Chapter 5
An environment shaped by centuries of farming and embracing new enterprise
The rural economy has strongly influenced the landscape and over 80 per cent of the South Downs is farmed. Past agricultural practices have produced some nationally valuable habitats including chalk downland and lowland heath, with traditional breeds specific to the area such as Southdown and Hampshire Down sheep significant in the past and still bred today. Many farmers and landowners are helping to conserve and enhance important habitats through environmental stewardship schemes. Large estates such as Goodwood, Cowdray, Petworth and Firle, with their designed parklands, have a significant effect on the landscape and the rural economy. The ownership of large areas of the eastern downs by local authorities or the National Trust is a legacy of the early 20th century conservation movements to protect the iconic cliffs and downs and the water supply to coastal towns.
Farming has always responded to the economy of the day and continues to do so. Some farmers are diversifying their businesses, for example by providing tourist accommodation and meeting the growing market for locally produced food and drink. Climate change and market forces continue to influence the landscape leading to new enterprises such as vineyards, and increasing opportunities for producing alternative energy, for example wood fuel.
However, the economy of the National Park is by no means restricted to farming. There are many popular tourist attractions and well-loved local pubs which give character to our towns and villages. The National Park is also home to a wide range of other businesses, for example new technology and science, which supports local employment.1
The National Park Authority has a duty to seek to foster the social and economic well-being of the local communities within the National Park in support of its purposes. So, it is important th at we understand the overall economic prosperity of the area before looking in more detail at business activity and the labour market in key areas such as farming, forestry and tourism, and the contribution that natural resources make to the rural economy.
The local economy
In 2008, the local economy of the National Park was estimated to be worth around £2.23 billion.2
The National Park has three primary market towns – Lewes, Petersfield and Midhurst; these are the main employment hubs and provide vital services to the surrounding rural areas. They have a significant impact on the make-up, services and local economies of the National Park as do the large urban areas around the boundary, such as Southampton, Portsmouth, Chichester, Brighton and Hove and Eastbourne.
The South Downs GVA3 per head of population compares well to the national, Hampshire, Brighton and Hove and West Sussex GVA, all of which are significantly higher than East Sussex. The productivity in the National Park’s economy is £46,850 per employee and is around the same as the English average and slightly lower than that for Hampshire and West Sussex (Figure 5.1).
Figure 5.1 GVA per employee job and GVA per head of resident population, 2008
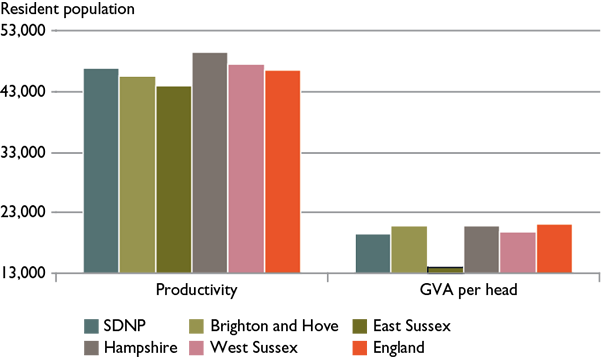
Source: Hampshire County Council (2011) South Downs National Park Local Economy, Hampshire County Council
|
Use of Office for National Statistics Data |
||
|
Where data is only available at the district level a South Downs ‘buffer’ has been created that covers the 16 districts which intersect a 5km zone around the National Park boundary. Data is reported for all 16 districts but the commentary concentrates on those local authorities which have land within the National Park.
|
Map 5.1
Illustrates the 5km buffer zone around the National Park which takes in 16 district and unitary authority areas
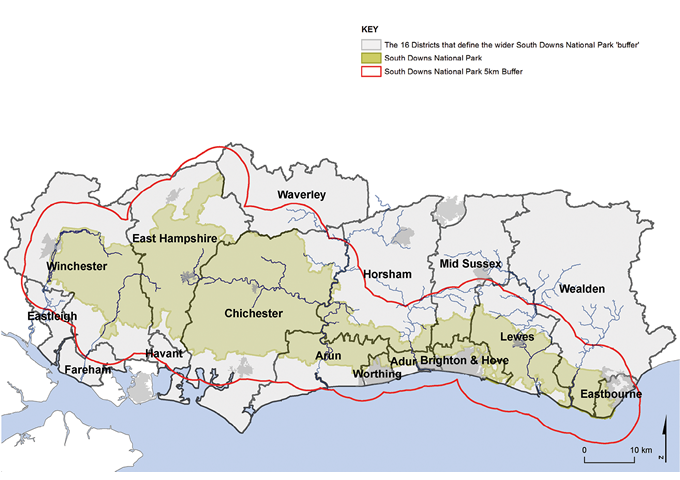
Maps prepared by: GeoSpec, University of Brighton; February 2012.
Source: South Downs Local Economy Report, Hampshire County Council, 2011
Ordnance Survey Crown Copyright © Licence No. 100050083.
Diverse rural businesses
An estimated 8,500–11,500 business units operate within the National Park, employing between 52,000–84,000 people.4 Figure 5.2 presents the breakdown of businesses by industry:
Professional, scientific and technical businesses account for just over 15 per cent of these, closely followed by wholesale and retail trade and repair of motor vehicles. More detailed information on the professional, scientific and technical businesses is not available at the National Park level.
The most significant difference from the south east region as a whole is the higher proportion of agriculture, forestry and fishery businesses.
The National Park also has a slightly higher percentage of businesses in the arts, entertainment and recreation sectors, which reflects its rural nature and its popularity as a place to visit, although the percentage of businesses in the accommodation and food services sector is slightly below that of the region.
Retail, the health sector and construction are slightly less represented compared with the south east region. This perhaps reflects the fact that these businesses are more likely to be situated in the major towns and cities immediately outside of the National Park.5
The percentage of information and communications businesses is also slightly less than for the region.
The National Park has a higher proportion of small (10–50 employees)and micro businesses (0–9 employees) than the national levels and a smaller proportion of medium (50–249 employees) and large (more then 250 employees) sized businesses.
Some evidence suggests that there are a large number of home-based businesses throughout the National Park that are not registered for VAT6 or PAYE7 and therefore not included in the figures above. Collectively they are likely to make a significant contribution to the local economy. Research carried out within Horsham District found that one in eight households contains a home-based business and that households in rural areas were 50 per cent more likely to have a home-based business than those in urban areas.8 According to The Petersfield Plan Baseline Report: Issues and Choices, East Hampshire has the highest index of home working in the country.9
|
We need data on the extent of home working. |
Business creation rates per head of population in the rural districts of West Sussex are higher than for the urban districts, in fact the number of jobs in the rural areas grew by 11 per cent in five years between 2003 and 2008 at a period when employment was static in West Sussex as a whole and declining in urban areas. As the National Park accounts for a large part of rural West Sussex it could be assumed that rural jobs are also growing within the National Park area although there is no data to confirm this.
We need data on rural job growth. |
For information on premises, business ages and business survival rates within the National Park. |
Figure 5.2 Comparison of percentage of businesses by industry type
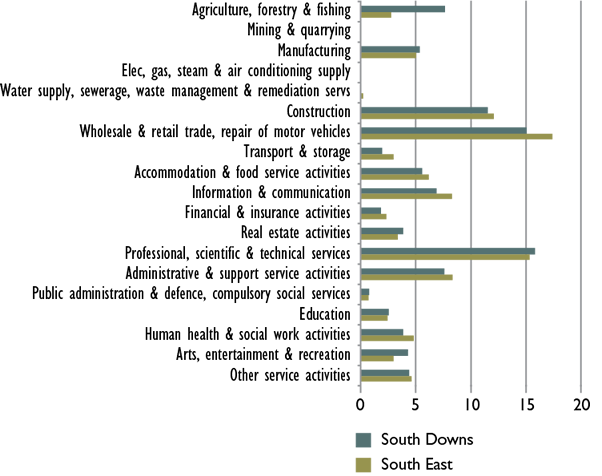
Source: Defra (2010) South Downs National Park Economic Profile – ‘Inter-Departmental Business Register 2008’, Defra
Rural businesses show a potential for growth but remain smaller overall and survival rates are mixed although those within Chichester and Horsham districts appear to be better than average. They may be constrained by a lack of premises for expansion, access to skills and infrastructure issues such as poor broadband access and transport.10
|
|
Key facts: Rural business |
|
78.4 per cent of businesses in the National Park employ fewer than five workers compared to 73.6 per cent in the south east and 71.1 per cent nationally |
|
|
In terms of total employment 32 per cent of jobs are in firms of less than 10 employees compared with 21 per cent of employment in firms of this size nationally |
|
|
Larger firms still account for nearly 20 per cent of employment but this is well below the national average of 30 per cent |
|
|
National Park businesses account for around 12.5 per cent of employment within the local authority districts. |
|
|
Source: Tym and Partners (2012) ‘BRES 2010’ in South Downs National Park Employment Land Review, South Downs National Park Authority |
|

Employment
Figure 5.3 shows that the employment structure within the National Park is similar to the south east but that certain sectors have higher representation such as education, arts, entertainment and recreation, manufacturing, accommodation and food services, and agriculture, forestry and fishing. Between them they account for nearly 40 per cent of employment. Despite the high percentage of business numbers, employment in agriculture, forestry and food is only 4 per cent in the National Park although this is still significantly higher than the 1 per cent in the south east as a whole.11
Other large sectors such as wholesale and retail trade, and health and social work account for a further 24 per cent of employment but these sectors are under-represented compared to the rest of the region.12
Figure 5.3 Breakdown of employment by industry by percentage
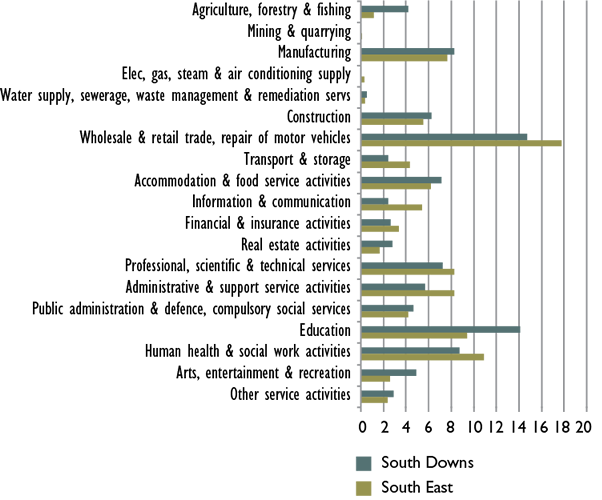
Source: Defra (2010) South Downs National Park Economic Profile – ‘Inter-Departmental Business Register 2008’, Defra
Resident workforce
The National Park is an affluent area with a well educated population that earn above average incomes. Although data is only available at district level it suggests:
that the National Park has a higher proportion of residents with NVQ4+ than either the regional or national average;
average annual gross household incomes within the National Park are also slightly higher than those for the south east (£39,700 compared with £39,230);13
out of the 12 districts that cross the National Park boundary, Wealden, East Hampshire, Horsham and Winchester residents’ earnings are significantly higher than overall earnings for work places;14
a high proportion of residents, particularly those of more rural areas are in managerial or professional occupations (Figure 5.4).
Figure 5.4 Working age residents in employment by major occupation group, Oct 2009–Sept 2010
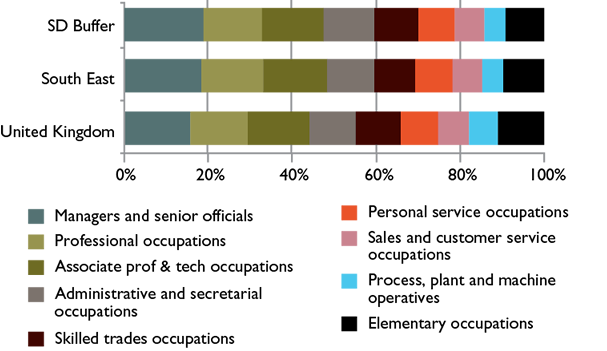
Source: Hampshire County Council Annual Population Survey (2011) South Downs National Park Local Economy, Hampshire County Council
Many of the high earners commute out of the National Park to London and other major urban areas in the south east (see the Transport Fact File for more travel-to-work patterns). They do, however, spend on local services which deliver ‘quality of life’ such as independent shops and local food and drink. Many lower paid workers who cannot afford to live in the National Park (see Chapter 8 for information on house prices) tend to commute into jobs in manufacturing, construction, public administration and education.
Unemployment
In February 2011, unemployment rates in the National Park were about half the national rate and a full percentage point below the south east. The National Park has well below regional and national levels of people claiming unemployment benefit (Figure 5.5).
Figure 5.5 Job Seekers Allowance claimant rate trends (%), Feb 2004–Feb 2011
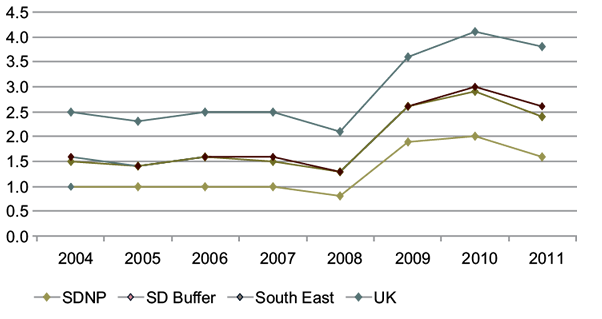
Source: Hampshire County Council DWP Claimant Counts, Ward level (2011) South Downs National Park Local Economy, Hampshire County Council
There are notable peaks in the numbers of vacancies in October and troughs in January, with smaller peaks and troughs in demand in the summer months, which probably reflects the number of businesses dependent on seasonal workers such as tourism.15
Broadband connectivity and speeds
At a time when businesses are carrying out more of their activities online and local authorities and other organisations are moving towards self-service delivery over the internet, reliable fast internet connections are essential to take full advantage of the opportunities presented by the online marketplace. As Map 5.2 shows, however, most of the rural areas throughout the National Park have either very low broadband speeds or none at all. Eighty per cent of the National Park has broadband speeds of less than 1 megabit (Mbit) per second. In fact, there are very few places (0.1 per cent) within the National Park that can get faster broadband i.e. speeds higher than 8 Mbit per second. The result of this is that many businesses, particularly in the rural areas, are severely disadvantaged by slow and unreliable internet connections.
In more than 90 per cent of the National Park area, broadband take up is less than 53 per cent of households and only Petersfield town centre has more than 75 per cent of households with broadband.
For percentage take up of broadband by household. |
West Sussex has many ‘not-spots’ (i.e. locations that are out of range of coverage or with very poor connection speeds). It also has three of the last four remaining non-broadband enabled exchanges in England – Sutton, East Marden and Plaistow, all of which are in rural areas. Data on broadband connectivity is being confirmed for the rest of the National Park.
Map 5.2
Broadband availability and speed
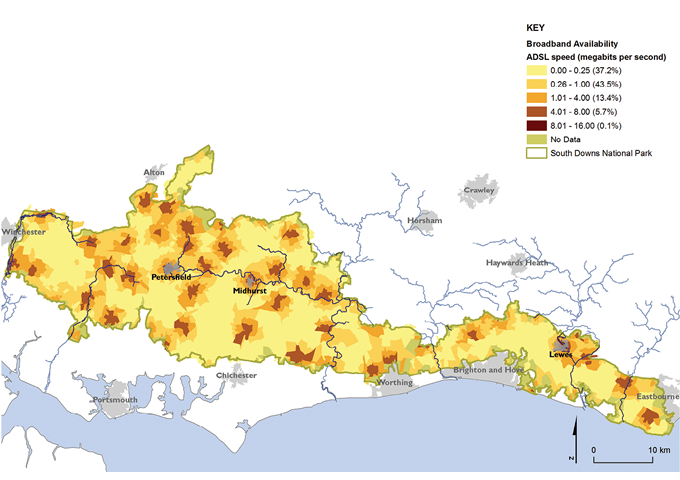
Maps prepared by: GeoSpec, University of Brighton; April 2012.
Source: Point Topic Ltd, 2012
Ordnance Survey Crown Copyright © Licence No. 100050083.
Farming
Farming16 and land management have shaped the South Downs over the centuries and help sustain many of the special qualities for which the National Park was designated – its distinctive landscapes, diverse habitats and species, archaeological features and local produce. Land managers are key to maintaining the special qualities of the National Park. Farming is also crucial to ecosystems services not only through its products, but also through regulating services (air quality, flood protection) and supporting services (soil formation, nutrient recycling) (see Chapter 1). Climate change and global markets are likely to have a major impact on the farming and land management of the National Park in the future. While farming is very important to the landscape, its contribution to gross domestic product (GDP) of the area is likely to be small. In 2007, the farming sector in the UK accounted for £5.5 billion gross value added, equivalent to about 0.5 per cent of total UK GDP (National Statistics 2009), a fall of 10.5 per cent since 1900 (National Statistics, 2003).
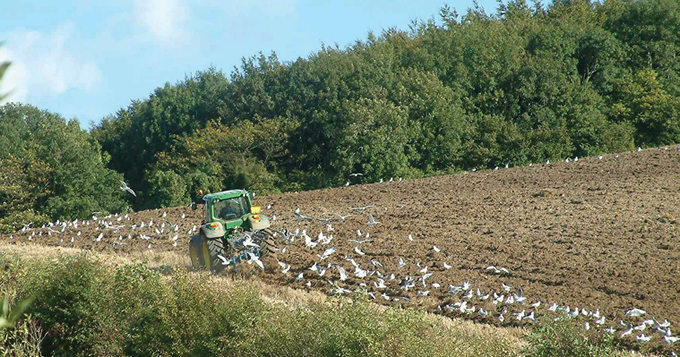
Ploughing on the South Downs © Nick Heasman/SDNPA
|
|
Key facts: Farming |
|
There are 928 registered commercial holdings within the SDNP17 (2010): |
|
|
The split between owned and rented is 60:40. |
|
|
64 per cent of holdings are less than 100ha. |
|
|
5 large private estates in West Sussex own 13.9 per cent (22,217ha) of the National Park area. |
|
|
11.7 per cent (19,313ha) is owned or managed by public bodies and NGOs such as the Forestry Commission, National Trust, Brighton and Hove City Council and Eastbourne Borough Council.18 |
|
|
Arable crops cover 44 per cent of agricultural land. |
|
|
37 per cent of agricultural land is in permanent pasture land. |
|
|
The remaining 19 per cent is made up of temporary grassland, rough grazing, woodland and other land. There are several major commercial growing enterprises including tree and plant nurseries and two commercial orchards, as well as 16 vineyards. Livestock: 126,333 sheep, of which 67,948 were lambs under one year old. 46,356 cattle, of which 9397 were dairy cows, 7130 were beef suckler cows, 11,577 calves under one year old and 18,252 other cattle. 17,080 pigs. 1,197,424 poultry. |
|

Source: Defra (2012) 2010 June Agricultural Survey, Defra
Land use
Around 85 per cent of land within the National Park is classified as agricultural (including some woodland) (see Map 5.3).19 Agricultural land is classified by grade according to the extent to which its physical or chemical characteristics impose long-term limitations on agricultural use for food production:
The majority of agricultural land within the National Park is either grade 3 (72 per cent) or grade 4 (22 per cent).
Less than 5 per cent is Grade 1 or 2 agricultural land i.e. the best and most versatile land.
|
Grade 1 is excellent quality agricultural land on which a wide variety of agricultural and horticultural crops can be grown and commonly includes top fruit, soft fruit, salad crops and winter harvested vegetables. Yields are high and less variable than on land of lower quality. Grade 2 is very good quality agricultural land where minor limitations affect crop yield, cultivations or harvesting. The level of yield is generally high but may be lower or more variable than grade 1. Grade 3 is classed as good to moderate quality agricultural land with moderate limitations which affect the choice of crops, timing and type of cultivation, harvesting or the level of yield. Where more demanding crops are grown yields are generally lower or more variable than on land in Grades 1 and 2. Grade 4 is classed as poor quality agricultural land where severe limitations restrict the range of crops and/or level of yields. It is mainly suited to grass with occasional arable crops (e.g. cereals and forage crops) the yields of which are variable. |
Crops
The proportion of grassland to arable has varied throughout history. Since World War II, however, there has been a fundamental shift in British agricultural policy as well as substantial technological improvements and changes in agricultural practice. The permanent chalk grassland area has significantly reduced while the percentage area of crops and fallow has increased from 24 per cent in 194020 to 44 per cent in 2010 (Figure 5.7).21 Exact acreages of different crops grown within the National Park are not available and will vary on an annual basis, depending on rotations, commodity prices etc. but general trends can be picked out from the Defra June 2010 Agricultural Census data report. Sixty-four per cent of the cropped area is down to cereals, mainly winter wheat, but also spring barley and oats, used for animal feed and human consumption. Other arable crops – mainly oil seed rape – account for a further 30 per cent of the cropped area, along with other crops such as brassicas, field beans, peas and maize. Oil seed rape and maize are relative newcomers. The majority of these products are sold on the national and international markets.
Figure 5.6 Number of farms by type in the National Park
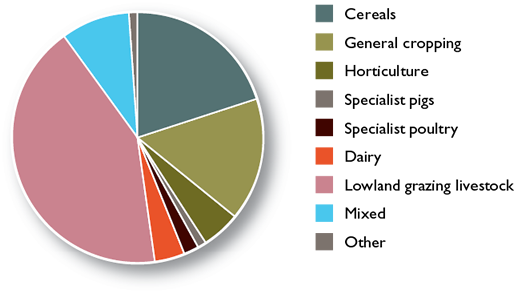
Source: Defra (2012) 2010 June Agricultural Survey, Defra
Map 5.3
Agricultural land classification
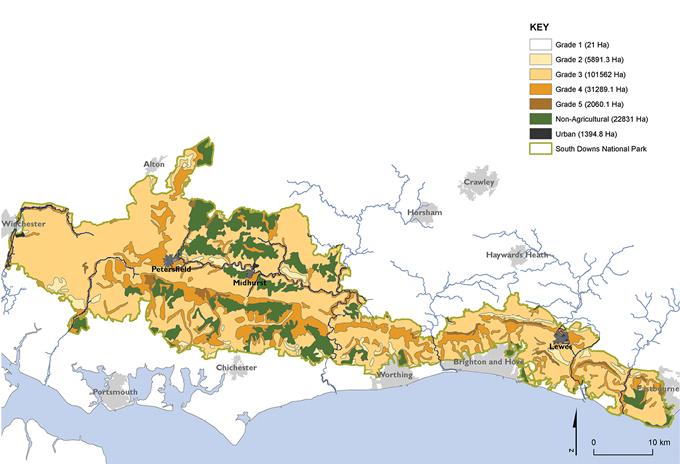
Maps prepared by: GeoSpec, University of Brighton; February 2012.
Source: Defra, 2009
Ordnance Survey Crown Copyright © Licence No. 100050083.
Figure 5.7 Agricultural land use by area (ha)
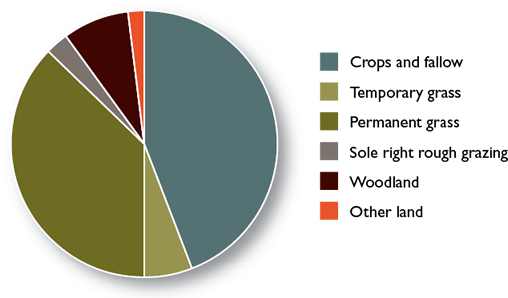
*NB this only includes woodland registered in the June Agricultural Survey.
Source: Defra (2012) Agricultural and Horticultural Survey 2010, Defra
Livestock
Overall numbers of cattle have changed little since 2009 although the numbers of dairy cows and calves under one year old have fallen, these have been replaced by an increase in other cattle.
There has been an increase of over 10,000 in the number of pigs.
While breeding ewes have increased only slightly since 2009 (155) there appears to have been a larger increase in lambs (2177) under one year old.
Agricultural infrastructure
There are no abattoirs within the National Park but there are 12 within 50 kilometres of the boundary, including Laverstoke and Farnborough in Hampshire, Guildford in Surrey, and Heathfield and Henfield in Sussex. The main livestock markets for the region are at Hailsham, Salisbury and Ashford. Hailsham is the closest of these, 5 kilometres or so from the eastern boundary of the National Park, whilst Salisbury is about 20 kilometres from the western end of the National Park.
Employment levels in agriculture
In 2010, agriculture employed in the region of 2921 people in the National Park, an increase of 282 from the 2009 June Survey figures.22 The majority of the increase was in the number of part-time farmers (see Table 5.1 for a breakdown). Mechanisation has caused the number of farm workers to fall dramatically since the 1950s when it is estimated that over 20,000 people were employed in agriculture.
Table 5.1 Breakdown of labour in agriculture
|
|
2010 |
|
Farmers full time |
613 |
|
Farmers part time |
818 |
|
Salaried managers full time |
135 |
|
Salaried managers part time |
56 |
|
Employees full time |
603 |
|
Employees part time |
396 |
|
Casual workers |
300 |
|
Total |
2,921 |
Source: Defra (2012) 2010 June Agricultural Survey, Defra
Income levels in agricultural sector
Regionally, the average farm business incomes for 2010/11 varied from £24,176 for grazing livestock to £99,913 for cereals.23 This reflects higher prices for cereals and oilseed rape compared to the previous year, while average incomes fell by 19 per cent in the livestock sector. Farm income figures for the National Park are not available. The Single Payment Scheme (SPS) makes an important contribution to average farm incomes for many farm types.24
The Single Payment Scheme
The Single Payment Scheme (SPS) provides a set payment of around €250 per hectare (2011 figure) for eligible land that is kept in good agricultural and environmental condition. The Rural Payments Agency is unable to provide information on the current area of land registered and the amount of Single Payment coming into the National Park, however it was estimated in 2000 that the government was spending over £21.5 million per annum on crops and livestock.25
Diversification
Around 75 per cent of holdings in the south east (including London) have diversified into other activities.26 In 2010, the NFU estimated that around half of the farms in the National Park had diversified.27 The type of diversification enterprise varies widely from horse liveries to business units, fishing lakes, camping, storage and wedding/conference venues.
|
Case Study Mike Tristram
Mike Tristram is Managing Trustee of the Sompting Estate, which includes c.1400 acres of land in West Sussex within the South Downs National Park. “The Single Payment Scheme (SPS) is a relatively stable factor in farmers’ annual income which helps to keep them in business. Continuity in farm occupancy is important for supporting knowledge, relationships, conservation and productivity. Local weather conditions and fluctuating market prices affect farm profits so the stability provided by SPS is really important. The Sompting Estate’s tenant farmers have diversified on a small scale through activities such as horse livery. In our sensitive landscape, however, the opportunity to stabilise incomes through diversification is limited, so our farmers’ core business of mixed livestock and arable farming has to be profitable, which SPS helps with. Our two farms within the National Park are in the environmental stewardship Higher Level Scheme (HLS) which complements SPS, helping with the extra cost of wildlife-friendly farming. Landowners like the Sompting Estate, in partnership with our tenants, make an essential contribution to the rural economy and food security. We reinvest rental income in repairs, developing infrastructure, conservation, woodlands, water, traditional buildings, and occasional small-scale diversification into commercial lets, although the payback on the cost of improvements to traditional buildings is typically very long. Some of our old farm buildings were too costly to convert and have been saved by an Historic Buildings grant from the HLS. Grants such as these can help us achieve both our own and the National Park’s conservation objectives.” |

|
Box 5.1 One aspect of diversification – vineyard One impact of climate change has been the increase in vineyards. Over the last 20 years, there has been an increase in the number and size of commercial vineyards and wineries across the south east, to approximately 80, of which an estimated 16 are within the National Park, covering approximately 120ha (growing to over 200ha in the next year or so). The soils and weather patterns on the south facing slopes of the chalk downland are ideal for grape production, and wine production is a viable diversification route for some farmers and land managers. Most grapes are made into still and sparkling white wine but red and rosé are also produced. A further 5 vineyards are very close to the boundary of the National Park. |
Agri-environment schemes
Agri-environment schemes fund farmers and land managers to deliver effective environmental management on their land (Table 5.2), which help to maintain the special qualities of the National Park. Environmental Stewardship builds on earlier initiatives such as the Countryside Stewardship and Environmentally Sensitive Areas schemes (Map 5.4). Entry Level Stewardship (ELS) is the first of these schemes for which all farmers are eligible if they carry out enough environmentally beneficial management measures. The National Park is also a target area for Higher Level Scheme (HLS) funding aimed at providing specific environmental benefits such as measures to increase farmland bird numbers. Map 5.5 shows the distribution of Environmental Stewardship agreements.
|
|
Key facts: Agri-environment schemes |
|
57 per cent of the National Park (93,561ha) is covered by agri-environment schemes – 66 per cent of all agricultural land. |
|
|
Spending on all agri-environment schemes nearly doubled between 2005/06 and 2009/10 from £4.567 to £8.305 million. |
|
|
Source: Natural England (2011) Agri-environment Scheme Uptake for the South Downs National Park, Natural England |
|

Table 5.2 Area and income from Environmental Stewardship schemes in the National Park (excluding Environmentally Sensitive Areas [ESA] and Countryside Stewardship Schemes [CSS])
|
|
Entry Level Stewardship |
Entry Level Plus Higher Level |
Higher Level Stewardship |
Organic Entry level |
Organic Entry level plus higher Level |
Total |
|
Area in Ha |
27,847 |
41,062 |
4,022 |
3,033 |
4,888 |
80,852 |
|
Cost £ |
£409,153 |
£4,238,200 |
£628,522 |
£101,616 |
£837,658 |
£6,215,149 |
Source: Natural England (2011) GIAS Report, Natural England
Sam and Zoe farming on the South Downs, Exceat © Anne Purkiss
Map 5.4
Countryside Stewardship and Environmentally Sensitive Area Schemes
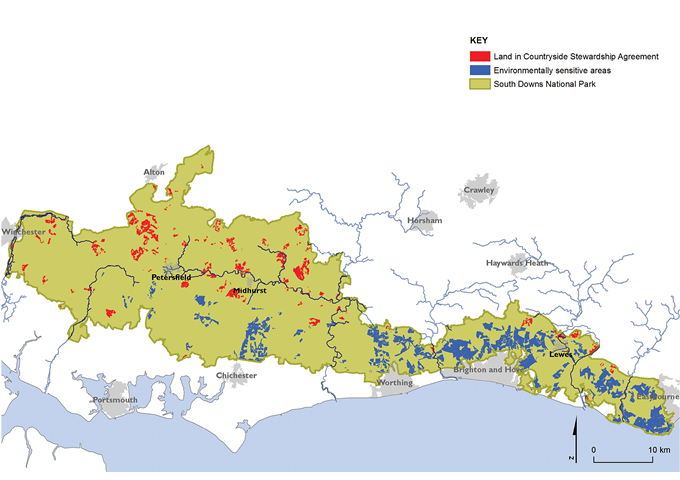
Maps prepared by: GeoSpec, University of Brighton; May 2012.
Source: Natural England, 2011
Ordnance Survey Crown Copyright © Licence No. 100050083.
Map 5.5
Environmental Stewardship Higher Level and Organic Level
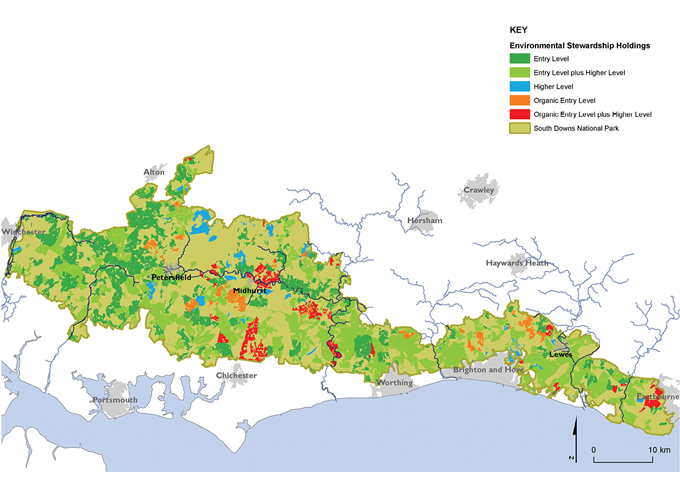
Maps prepared by: GeoSpec, University of Brighton; April 2012
Source: Natural England, 2011
Ordnance Survey Crown Copyright © Licence No. 100050083.
Forestry
Like much of the south east, some parts of the National Park are heavily wooded. The widespread mix of deciduous and coniferous woodland covers 23.8 per cent and is a distinctive feature of the western half of the National Park. Of this, 17,351ha is ancient semi-natural woodland (ASNW) and just under one-quarter is planted ancient woodland sites (PAWS).
|
|
Key facts: Forestry |
|
Total area of woodland 38,420ha (23.8 per cent of the National Park area). |
|
|
Roughly 50 per cent of woodland in the National Park is ancient semi-natural woodland. |
|
|
4.6 per cent of woodland is coppice. |
|
|
Over half of all coppice is under 2ha. |
|
|
The Forestry Commission (FC) manage 14 per cent (5526ha) of woodland. |
|
|
7 major landowners (including the FC) own 56 per cent of the woodland. |
|

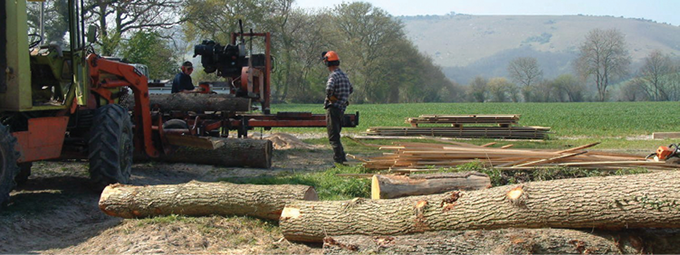
Figures on the income from forestry are not currently available but it is estimated that if all of the 38,420ha of woodland were actively managed this could potentially contribute some £22.8m to the local economy.
|
|
Key facts: Woodfuel potential |
|
Forestry Commission estimate that 34,000ha could be available within the National Park area for the production of woodfuel: |
|
|
This could produce 60,000m³ of wood per year. |
|
|
An equivalent of 140,000,000kWhrs. |
|
|
Enough to heat 9000 homes. |
|
|
In oil equivalent terms (at 60p per litre) the energy embedded in the woodfuel has a value of more than £8 million/year. |
|
|
There are at least 11 significant sized woodfuel boilers installed with more planned. These add up to in excess of 2000kW and use around 2000m3 per year. |
|
|
Source: Forestry Commission (April 2012) Opportunities for the Woods of South East England, Forestry Commission |
|

|
|
Key facts: UK timber utilisation |
|
Construction industry remains the largest market for sawn and planed |
|
|
Sawn softwood volumes have generally declined especially the volumes used in the construction industry since the onset of recession in 2008. |
|
|
Other important markets are the pallets and packaging industry, and the fencing and outdoor markets which have also declined but to a lesser extent than the construction industry. |
|
|
In 2010, domestically produced consumption grew by an estimated 8 per cent and was projected to grow further in 2011, raising the share of sawn softwood consumed in the UK to 41 per cent. The construction industry use the lowest share of UK produced sawn softwoods (21 per cent) and the fencing and outdoor uses the highest (89 per cent). |
|
|
Source: Moore, Nicholas (March 2012) Timber Utilisation Statistics 2010 & 2011 Estimates – An Updated Study for the Forestry Commission, Forestry Commission |
|

Map 5.6
Woodland distribution across the South Downs National Park
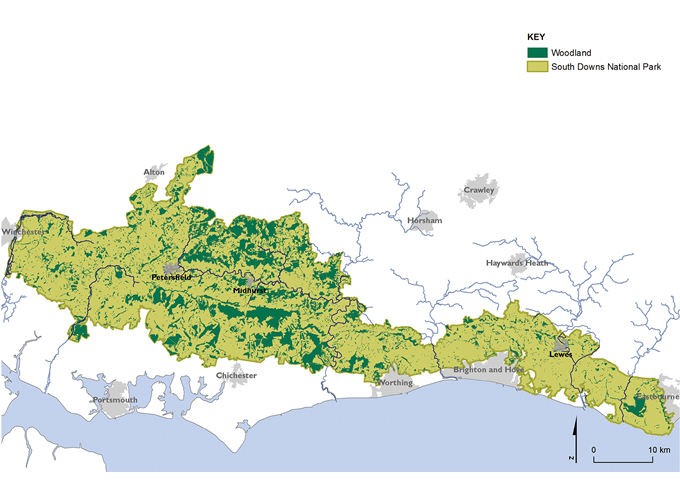
Maps prepared by: GeoSpec, University of Brighton; April 2012.
Source: National Forest Inventory, Forestry Commission, 2010
Ordnance Survey Crown Copyright © Licence No. 100050083.
Tourism and the visitor economy
The National Park is a popular visitor destination, with people drawn to the area by its outstanding landscapes, cultural heritage, wildlife and opportunities for recreation. Tourism brings significant money into the area and supports a higher proportion of jobs than the surrounding area in tourism related industries. The majority of visitors are from the surrounding areas.
|
Case Study Flair Kitching
Flair Kitching is Assistant Manager of Gilbert White’s House & Garden and The Oates Collection, located in the Hampshire village of Selborne. The museum celebrates three explorers of the natural world and attracts some 30,000 visitors each year, including those enjoying the education and lifelong learning activities hosted at the Gilbert White Field Studies Centre. ”One of the top challenges for us is to effectively market our somewhat hidden heritage gem – so partnership working is key to our continuing success. Whilst we have always worked with other local attractions, the creation of the South Downs National Park has presented new opportunities to do this. For example we are working closely with Petersfield Museum, Jane Austen’s House Museum and Chawton House Library to create a joint brand to attract visitors to our corner of the National Park. We are optimistic that as the South Downs National Park becomes increasingly recognised we, as an independent charitable trust, alongside the local economy, will further flourish. We are delighted to work with colleagues to steadily increase visitor numbers to an area that has perhaps not previously featured as a top tourist destination, but offers much beauty and variety – not to mention delicious cream teas!” |
|
|
Key facts: Tourism |
|
There are an estimated 39 million day visits to the National Park each year (2003/04).28 |
|
|
Of which, an estimated 4.34 million day trips within the National Park are by residents of the area (see Chapter 6 for more detail). |
|
|
Only 1.2 million days of their holidays were spent by tourists staying in the National Park. |
|
|
The average length of stay for visitors is 5 nights. |
|
|
The most popular places to stay were Alfriston (13 per cent) and Lewes (11 per cent). |
|
|
6.8 million day trips were made by tourists staying outside the National Park. |
|
|
26.7 million day trips were made into the National Park from homes outside the area. |
|

Visitor stay and spend
Visitors staying in accommodation within the area were dispersed across a wide variety of towns and villages. Many more visitors to the area stay in accommodation outside of the boundary.
The total value of these visits to the region was around £333 million. However, the visitor spend within the National Park was estimated at only £177.7 million: 29
63 per cent of spend was from day visitors from home (average spend of £8.29 per person);
18 per cent of spend was from day visitors into the National Park but staying in holiday accommodation outside the area; and
18 per cent of spend was from staying visitors (average spend of £11.28 per person, £27.68 including overnight accommodation).
Catering and retail had the highest proportion of spend at 31 per cent and 26 per cent respectively while accommodation was the lowest at 13 per cent.
Although day visitors from home spend less these are currently of greater value because there are far more such day trips by local people.
Tourism businesses
There are 803 tourism businesses within the South Downs National Park:30
Figure 5.8 Breakdown of tourism businesses
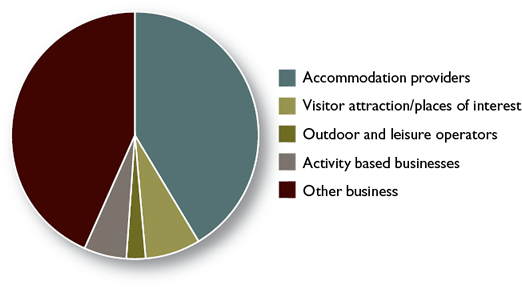
The 2004 Survey estimated that the total number of jobs supported in the tourism industry in the National Park was 7218, although a high proportion of these are seasonal or part-time. This figure equates to a full-time equivalent of 4137.
Anecdotal evidence suggests that during high profile events such as Goodwood Festival of Speed there is very little spare accommodation for some distance. However, data gathered so far in the new business survey does not suggest a shortage of serviced accommodation, although the survey sample size was disappointingly low. Occupancy levels for serviced accommodation were 43 per cent while for self catering they were higher at 61 per cent. Although the number of camping and caravan sites has increased slightly (see Table 5.3) there is generally a lack of low cost accommodation, particularly along the South Downs Way.31
A new visitor survey is being carried out to provide more up-to-date visitor figures. The previous survey was based on the proposed National Park area rather than the final boundary, so figures will not be directly comparable. However, it should be possible to pick out some trends.
The new visitor survey will give us a range of data such as visitor numbers, spend, length of stay, impact on the environment, residents’ attitudes and information about the number of businesses that are supported and their views on sustainability.
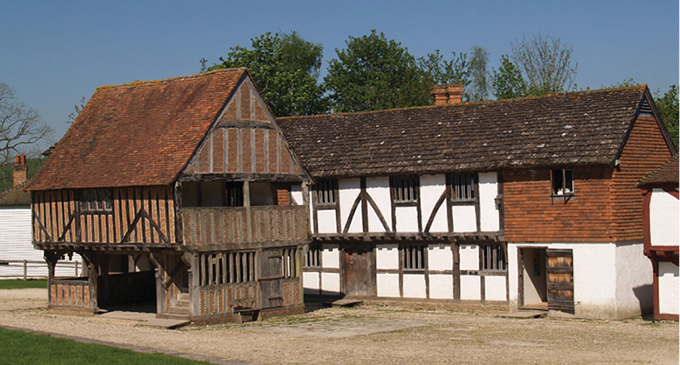
Weald and Downland Museum, Singleton © SDNPA
Table 5.3 Breakdown by accommodation type
|
Visitor Accommodation |
Number |
Bed spaces |
|
|
|
2004 |
2011 |
2011 |
|
Bed and Breakfast and guest accommodation |
161 |
197 |
1171 |
|
Hotel accommodation |
35 |
31 |
2305 |
|
Caravan and camping sites |
11 |
15 |
3952 |
|
Self-catering accommodation |
77 |
85 |
458 |
|
Youth hostels |
5 |
4 |
169 |
|
All visitor accommodation |
289 |
332 |
8055 |
Sources: Tourism South East (2012) Progress Report on Visitor/Residents and Business Survey for the South Downs National Park Authority; Tourism South East (2004) Visitor Survey of the Proposed South Downs National Park 2003–2004, Countryside Agency
Local produce
Food and drink are growing industries within the National Park. In addition to the 16 vineyards there are also 12 breweries and one cider maker. The products of these and seasonal produce such as apples, pears and plums are sold in a number of farm shops and community shops. As well as the sale of primary products such as milk, meat, eggs fruit and vegetables, a wide variety of products is also processed or manufactured such as ice cream and cheese, as well as breads and cakes, jams and chutneys.
There are numerous pubs and restaurants providing a valuable service for visitors and residents alike, many of which support local producers by serving local produce and providing a real sense of place.
Farmers’ markets also take place once a month in Petersfield, Midhurst, Petworth, Slindon, Lewes and Firle, as well as in towns and cities around the edge of the National Park such as Steyning, Arundel, Brighton and Hove, Shoreham, Winchester and Alton. A report by Action in Rural Sussex in 2004 found that Sussex Farmers’ Markets are of great economic importance to local food businesses.32 An evaluation of the Hampshire Food Festival in 2011 recorded that 221,015 visitors attended 93 events across the county and resulted in an estimated £3.82 million visitor spend.33 Specific numbers of food and drink processing businesses and their value to the National Park economy are unavailable.
We need data on the number and range of food and drink processing businesses, and their value to the local economy. |
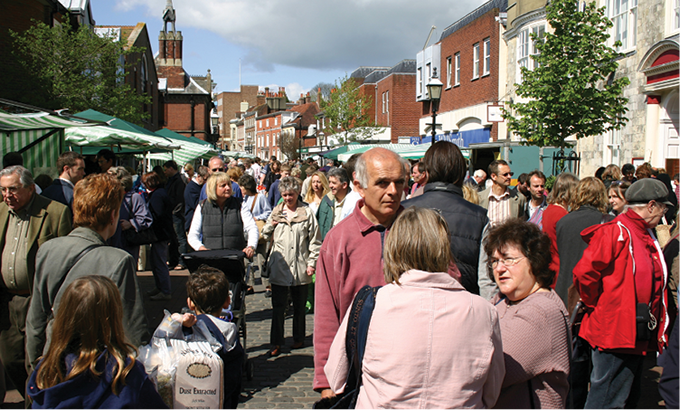
Lewes Farmers’ market © www.commoncause.org.uk
Minerals
The National Park has a wealth of mineral resources that are important to the economy. The minerals are used for a wide range of applications related to construction, manufacturing, agriculture and energy supply.
The ‘Folkestone Bed’ formation is a major source of soft sand (which is mainly used as an aggregate) which runs from the Petersfield area in the west to Ditchling in the east (see Map 2.2 Solid Geology). Sand is currently being extracted from the following sites:
Stanton’s Farm Quarry, Novington;
Heath End Quarry, Duncton;
Minsted Sandpit, Stedham; and
West Heath Quarry, West Harting.
Gravel and some sharp sand is found along the southern boundary of the South Downs, overlying the chalk to the north of a line approximating to the route of the A27. There is currently one active gravel site at Valdoe Quarry, Goodwood. There are also several former gravel workings within and close to the National Park boundary.
For a map of drift geology and superficial deposits which shows deposits of clay, sand and gravel. |
Local clay is vital to enable local brickworks to produce distinctive bricks which contribute to the character of settlements. Clay is extracted for brick making at the Pitsham Brickworks in Cocking.
Chalk has been worked in the South Downs for many centuries and used for a variety of purposes including agricultural lime, bulk fill in road construction and cement production linked to Shoreham Cement Works when it was in operation. Demand for chalk is now limited and there are a number of dormant and inactive sites within the National Park. The sites currently operating are:
Duncton Chalk Quarry, Duncton; and
Newtimber Chalk Works, Pyecombe.
Sandstone within the National Park is found within the Hythe beds of the Lower Greensand. Current workings are at Bognor Common Stone Quarry near Fittleworth – where it is crushed on site and used as aggregate for local paths, hardcore and constructional fill, as well as rockery and ornamental stone. Winter’s Pit in Easebourne is also active and produces building stone. A continuing supply of local building stone is important for new building and for restoration to maintain local vernacular architecture.
Oil and gas reserves are trapped in faults and folds confined to the Corallian Beds and the lower Oolites of the Jurassic period. Oil and gas development is controlled by the Government through the granting of licenses to search, bore for and extract hydrocarbons. Planning permission is required for each stage of site development – exploration, appraisal and production. There are five oil and gas sites such as at Singleton and Rowland’s Castle – some are in production and some are at the exploration and appraisal stages.
Sandpit, Stedham Common © SDNPA
For information about waste sites and services. |
Data source: Environment Agency, 2011 Ordnance Survey Crown Copyright © Licence No. 100050083
|
Key data: An environment shaped by centuries of farming and embracing new enterprise South Downs economy The National Park Authority, with its partners, will monitor changes in the National Park’s economy: Key data: GVA34 per head; Number of businesses; Number of jobs; Unemployment levels; Numbers of in and out commuters; Broadband connectivity and speed. Current position: GVA £19,450 per head; Number of businesses: 8500–11,500 (estimated); Number of jobs: 52,500–83,800; Unemployment levels: 1.6 per cent; Numbers of in commuters: 24,700; Number of out commuters 22,400; Broadband connectivity and speed: 80.7 per cent with speeds of less than 1 megabit per second. Data source: Hampshire County Council (2011) South Downs National Park Local Economy, Hampshire County Council; Defra (2010) South Downs National Park Economic Profile, Defra; Point Topic (Jan 2011) Broadband availability and speed data, Point Topic Responsibility for data collection: Office for National Statistics. Farming The National Park Authority, with its partners, will monitor changes in farming within the National Park: Key data: Total number of commercial land holdings; Average farm size and type; Total numbers of and types of livestock; Areas of crop types. Current position: Number of commercial land holdings: 928; Average farm size: 66ha; Numbers of livestock: Sheep – 126,333; cattle – 46,356; pigs – 17,080; Areas of crop types: Cereals – 31,471ha; other arable crops – 14,678ha; horticulture – 700ha; permanent grass – 41,284ha; rough grazing – 3449ha. Data source: Defra (2009) Land Use Classification, Defra; Defra (2012) Agricultural and Horticultural Survey, Defra Responsibility for data collection: Defra Agri-environment Schemes The National Park Authority, with its partners, will monitor changes in how much land is managed through agri-environment schemes: Key data: The area of land, in hectares, in the National Park managed through existing or future agri-environment schemes, and this area as a percentage of the total area of the National Park. Current position: A total of 93,561ha of land, or 57 per cent, of the National Park (66 per cent of agricultural land) is managed through agri-environment schemes. Data source: Natural England (2011) Agri-environment Scheme Uptake for the South Downs National Park, Natural England Responsibility for data collection: Natural England. Forestry The National Park Authority, with its partners, will monitor the area of woodland within the National Park and how much is managed through the England Woodland Grant Scheme: Key data: Area of woodland cover in hectares; Area of woodland under EWGS in hectares and as a percentage of the total woodland area; Area with a recognised management plan or Forest Design Plan; Area of Ancient Woodland under EWGS and as a percentage of the Ancient Woodland Area. Current position: 38,420ha of woodland; Approximately 14,720ha (38 per cent) is managed under the Woodland Grant Scheme for England (EWGS); Area under recognised management plan or Forest Design Plan not currently available; Area of Ancient Woodland under EWGS 6754ha (40 per cent of EWGS area). Data source: Forestry Commission (2010) National Forest Inventory, Forestry Commission Responsibility for data collection: Forestry Commission. Tourism The National Park Authority, with its partners, will monitor changes in tourism to the National Park: Key data: The number of visits; percentage of day visits to staying visits; Visitor spend; Number and type of tourism businesses; Number of businesses with ‘Green’ accreditation such as GTBS. Current position: 39 million visitor days spent in the National Park (34.72 million were visits by non-residents) of which 3.5 per cent were by tourists staying in the South Downs; Visitor spend: £1.77 million; There are 332 accommodation businesses, 52 attractions and 126 food and drink establishments; Number of businesses in the National Park currently accredited under GTBS 16; 10 Gold, 4 Silver, 1 Bronze and 1 awaiting grading. Data source: Tourism South East and Geoff Broom Associates (2004) Visitor Survey of the proposed South Downs National Park 2003–2004, Countryside Agency; Tourism South East (2012) Progress Report on Visitor/Residents and Business Survey for the South Downs National Park Authority, Tourism South East; Green Tourism Business Scheme (March 2012) Progress Report, Green Tourism Business Scheme Responsibility for data collection: South Downs National Park Authority. Minerals The National Park Authority will monitor mineral extraction in the National Park: Key data: The number of extraction sites, area and tonnage. Current position: Working sites: Soft sand – 4, gravel and sharp sand –1, clay –1, chalk – 2, sandstone – 2, oil and gas – 5 (in production and exploration sites); Information on tonnage for individual sites is not available as this is economically sensitive data. Data source: Local Authorities (Annual) Local Authority Annual Monitoring Reports, Local Authorities Responsibility for data collection: South Downs National Park Authority as the Minerals Authority.
|
Transport Fact File
Transport Fact File |
Footnotes
Click on the footnote number to take you back to your place in the document.
1 South Downs National Park Authority (2011) Special Qualities of the South Downs National Park, South Downs National Park Authority
2 A district level estimate for the LSOA definition of the SDNP based on Regional Gross Value Added, Business Register and Employment Survey and Experian UK Local Market Forecasts; South East Region in Hampshire County Council (2011) South Downs National Park Local Economy, Hampshire County Council
3 GVA measures the contribution to the economy of each individual producer, industry or sector in the United Kingdom – the value that has been added during the process of production of goods and services
4 A definitive figure is difficult to arrive at as it depends on the calculation used. Source: Hampshire County Council (2011) South Downs National Park Local Economy – ‘Neighbourhood statistics 2010’, Hampshire County Council; Defra (2010) Inter-Departmental Business Register 2008, Defra
5 Ibid
6 All businesses that are liable for VAT must register with HM Revenue & Customs. The April 2011 limit for registration is an annual turnover of £73,000 or more. Below this level registration is voluntary
7 All businesses employing any member of staff who earned over £144 per week or £523 per month in the 2011/12 tax year must register a PAYE scheme with HM Revenue and Customs
8 Horsham District Council (2008) Home-based Businesses, Horsham District Council
9 David Lock Associates (June 2011) Petersfield Plan Baseline Report: Issues and Choices, South Downs National Park Authority/East Hampshire District Council
10 Defra (2010) South Downs National Park Economic Profile – Inter-Departmental Business Register 2008, Defra
11 Ibid
12 Tym and Partners (2012) South Downs National Park Employment Land Review, South Downs National Park Authority
13 CACI Paycheck data (2009) South Downs National Park Local Economy, Hampshire County Council September 2011
14 Annual Survey of Hours and Earnings, District level (2010), South Downs National Park Local Economy, Hampshire County Council 2011
15 ‘NOMIS Jobcentre Plus Notified Vacancies (standardised to 4 1/3 week flows), Ward level’ in Hampshire County Council (2011) South Downs National Park Local Economy, Hampshire County Council
16 Here, farming is taken to include horticulture, viticulture, commercial orchards and tree nurseries
17 Commercial holdings are those with significant levels of farming activity. i.e. any holding over 5ha of agricultural land, 0.5ha of vegetables, or 0.1ha of protected crops, or more than 10 cows, 50 pigs, 20 sheep, 20 goats or 1000 poultry. Some farm businesses may have more than one holding
18 Just under 1500ha of land managed by public bodies and NGOs is leased from one of the large estates and therefore also included in the 13.9 per cent figure.
19 Defra (2009) Agricultural Land Classification, Defra
20 Smart and Brandon (2007) The Future of the South Downs, Packard Publishing
21 Defra (2012) June 2010 Agricultural Survey Data for South Downs National Park, Defra
22 Defra (2012) Agricultural and Horticultural Survey 2009 and 2010, Defra
23 Farm business income is essentially the same as net profit, which, as a standard financial accounting measure of income, is used widely within and outside agriculture
24 Defra (2011) Farm Accounts in England – Results from the Farm Business Survey 2010/11, Defra (based on income from agricultural production, agri-environment, diversification and the single payment)
25 Smart and Brandon (2007) The Future of the South Downs, Packard Publishing
26 Defra diversification data in Hampshire County Council and Hampshire Economic Partnership (2010) Hampshire Farming Study Review 2010, Defra
27 NFU (2010) Why Farming Matters to the South Downs, NFU
28 Tourism South East and Geoff Broom Associates (2004) Visitor Survey of the Proposed South Downs National Park 2003–2004, Countryside Agency
29 Ibid
30 Tourism South East (2012) Progress Report on Visitor/Residents and Business Survey for the South Downs National Park Authority
31 Ibid
32 Julie Withers and Anne-Marie Bur/Action in Rural Sussex (2004) Sussex Farmers’ Markets Research, Action in Rural Sussex
33 Hampshire Fare (2011) Hampshire Food Festival 2011 Evaluation Report Summary, Hampshire Fare
34 GVA measures the contribution to the economy of each individual producer, industry or sector in the United Kingdom – the value that has been added during the process of production of goods and services