Chapter 8
Distinctive towns and villages, and communities with real pride in their area
The South Downs National Park is the most populated National Park in the United Kingdom, with around 110,000 people living within the boundary. Significantly more people live in the major urban areas and villages that surround the National Park including communities that are actively involved in the South Downs such as Brighton and Hove, and Eastbourne.
The South Downs is unique in having the largest market towns of any UK National Park – Lewes, Petersfield and Midhurst. The character and appearance of these and many other settlements throughout the National Park derives in large part from the distinctive local building materials. Picturesque villages like Selborne, Charlton and Alfriston blend into their landscapes.
Many of these settlements contain strong and vibrant communities with much invested in the future of where they live, and a sense of identity with their local area, its culture and history. Across the National Park there are also communities of people who come together through common interests, for example, farming, conservation and recreation. These communities dedicate time and resources to enhancing community life, conserving what is important to them and planning for future generations.1
This chapter looks at the population of the National Park in detail and describes the current situation on housing, fuel poverty and rural crime. It also focuses on services available to local communities and the active involvement of people in community life.
|
Census data 2001 The majority of data used to compile this section of the report has been taken from the 2001 census results. When data was collected for the 2001 census, the South Downs National Park did not exist as a statistical geography. There are, therefore, no accurate census datasets for the National Park area. As data could not be collected to the National Park boundary a 33 per cent threshold formula has been used. Essentially for data available at certain geographies (LSOA, ward level etc.), a 33 per cent population threshold has been applied to provide an estimate value for the National Park. This means where LSOA or wards are split by the National Park boundary, the whole of the LSOA or ward is included as being part of the National Park statistics if more than 33 per cent of that LSOA or ward population falls within the National Park boundary. This applies to Output Areas, Lower Super Output Areas, Middle Super Output Areas and Wards. All forecast data (mid-year population estimates etc) has also been calculated using the same formula. Although the data is the most accurate available it should be noted that there will be some inaccuracy. The 2011 census results will be available for the National Park area so this will provide a more accurate position for the topics within this chapter. It is expected that the majority of 2011 census data will be available in 2012–13. |
Box 8.1 ONS category definitions
|
Terminology |
Definition |
|
Output Areas |
Minimum population: 100 (approximately) Recommended population: 300 2001 Census Output Areas were built from clusters of adjacent postcodes which have similar characteristics (tenure of housing, dwelling type etc). They had approximately regular shapes and tended to be constrained by obvious boundaries such as major roads. They were designed to have similar population sizes and be as socially homogenous as possible. Using the 33 per cent population threshold there are 384 Output Areas in the National Park area. |
|
Lower Super Output Area |
Minimum population: 1,000 Average population: 1,500 Made up of groups of Output areas (typically five). Constrained by the boundaries of electoral wards used for 2001 Census outputs. Using the 33 per cent population threshold there are 70 LSOAs in the National Park area. |
|
Middle Super Output Area
|
Minimum population: 5,000 Average population: 7,200 Made up of groups of Lower Super Output Areas. Constrained by the 2003 local authority boundaries used for 2001 Census outputs. Using the 33 per cent population threshold there are 17 MSOAs in the National Park area. |
|
Wards (electoral wards) |
Population can vary dramatically, English average 5,500 Electoral wards are the areas defined to elect local councillors. A specific area of a district or borough defined for electoral, administrative or representational purposes. |
The population of the National Park and its surrounding areas
The population of the National Park is estimated to have increased by 3 per cent over the period between 2002 to 2009, this is an increase of approximately 3,000 people. Figure 8.1 shows how this increase in population has been slower than that in the south east of England where the population has increased by 5 per cent in the same period.
|
|
Key facts: Population |
|
Around 110,400 people live in the National Park (2009). |
|
|
1.97 million people live in the 16 local authority areas which intersect with the 5km boundary of the National Park. This is known as the ‘Wider National Park Buffer’.2 |
|
|
The population density in the south east is 440 people per km2 but the population density in the National Park is 67 people per km2. |
|
|
In Petersfield, Midhurst and Lewes the population is much more concentrated than the rest of the National Park, with a density above the regional average although this is still relatively low compared to the urban areas surrounding it.3 |
|

Although other national parks include small market towns, the South Downs National Park has two major settlements in Lewes and Petersfield with populations of 15,998 and 13,303 (Census 2001) respectively. This compares to the next largest settlement population in a national park (Brecon in the Brecon Beacons with a population of 7,901). The market towns, including Midhurst, and the larger villages provide a vital service to the surrounding rural communities, through community services such as banking, post offices, secondary schools and shopping facilities, and access to the public transport network operating throughout the National Park.
The major urban settlements surrounding the National Park also play an important role in the provision of services, housing and transport for rural communities in the National Park.
Figure 8.1 Population growth in the National Park compared with the south east (2002–09)*
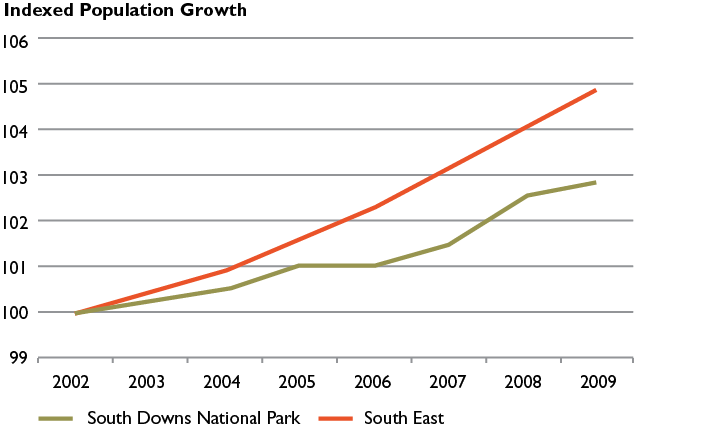
Note: *This graph shows indexed population growth – a means of comparing relative growth across the south east and the South Downs National Park. This is not a comparison of population totals.
Source: Office for National Statistics (2009) Mid year population estimates, Office for National Statistics
Population age
The age structure of a population can provide a good indicator of the sustainability of a community, with an ageing population relying more heavily on services and a decreasing working age population impacting on the availability of people to fill local jobs and provide vital services.
The population age structure of the National Park in Figure 8.2 shows a lower number of young people and a higher proportion of people aged 40–65 years old.
Figure 8.2 Population age structure of the South Downs National Park
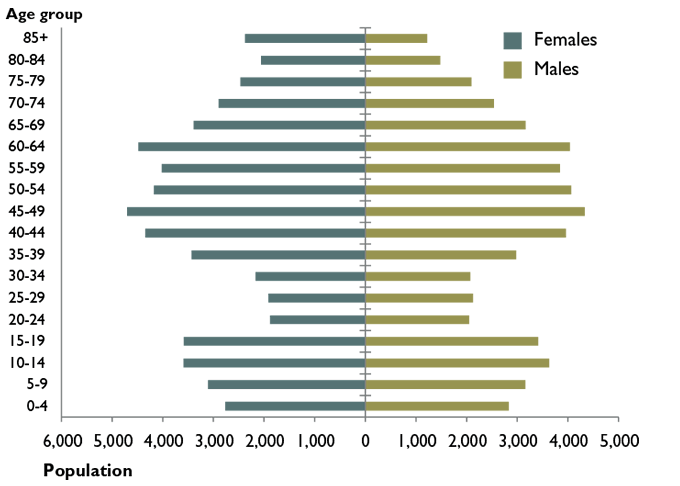
Source: Office for National Statistics (2009) Mid year population estimates, Office for National Statistics
While the total population of the National Park is estimated to have grown by 3 per cent over the last decade, the young and working age population has remained relatively static compared with the south east average increase of 5 per cent. Based on 2009 figures, of the total population of the National Park:
around 17 per cent are children under 14; (16 in south east);
21 per cent are aged 65 and over (17 in the south east); and
the remaining 62 per cent is the working age population aged 15–64 (65 in the south east).4
Figure 8.3 provides a more detailed breakdown of the age of the National Park’s population. It shows an increase in people aged 65 and over and a reduction of those in their thirties.
Figure 8.3 Percentage growth in population by age5
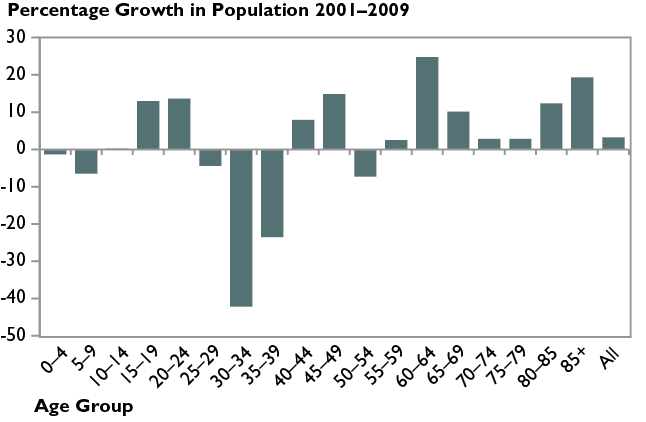
Source: Office for National Statistics (2009) Mid year population estimates, Office for National Statistics
The population of the National Park is therefore ageing, although this mirrors the national trend. The number of people aged over 65 is significantly higher in percentage terms than found in the south east as a whole, though this will be a common pattern in many rural areas.
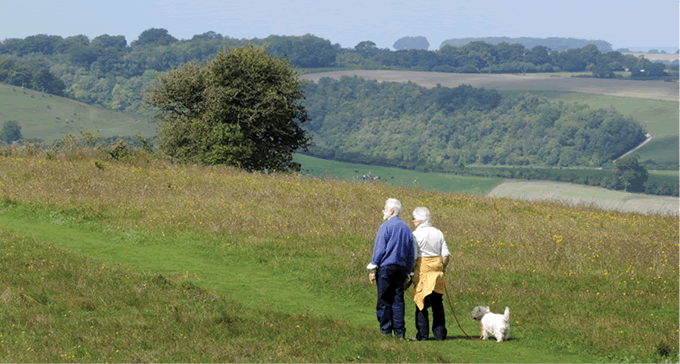
Walking on Old Winchester Hill © Anne Purkiss
Where people live in the National Park
Map 8.1 shows the population distribution in the National Park and its immediate surroundings. The map clearly shows that population density is relatively low in the rural areas of the National Park with higher density of population in the market towns and the urban conurbations surrounding the boundary.
Economic and social circumstances of the National Park population
While the largest proportion of the National Park’s population is relatively well off, there are areas in or around the main market towns with lower incomes and greater unemployment.6
The high price of housing in the National Park often means that:
people on lower incomes are unable to live in the National Park and must travel into it for employment;
employers face challenges in finding appropriately qualified staff; and
there is more traffic on the roads within the National Park as people travel to and from work.
Socio-economic information provides a picture of communities based on various characteristics such as age and ethnicity, household composition and type, qualifications, employment status and employment by industry.
For the distribution of socio-economic characteristics of households in the National Park. |
Figure 8.4 shows a comparison of social structures within the National Park and the south east region. With the exception of the high proportion of countryside and low proportion of city living, the National Park is similar in social structure to the rest of the south east. Perhaps more apparent is the under representation of multicultural communities. However, this is generally the case in most rural areas in the south east. The barriers preventing minority groups accessing the National Park are discussed in more detail in Chapter 6.
Figure 8.4 Comparison of the socio-economic characteristics between the National Park and the south east
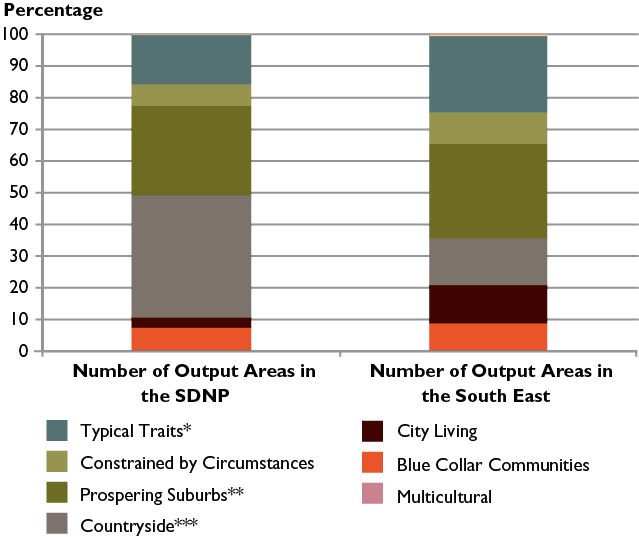
* The typical traits category are those working in a wide range of industries, living mainly in terraced housing which is either owner occupied or privately rented. This category has a mix of ethnic backgrounds and household incomes.
** The prospering suburbs category are those working in a professional or semi-professional capacity, living in detached homes, mostly privately owned with older children or children who have left home. They are generally prosperous people who have established themselves in the workplace.
*** The countryside category are well off individuals living in rural or semi rural locations, mostly living in detached housing, working in agriculture or a professional capacity and often working from home.
In addition to the socio-economic structure of the National Park the Indices of Multiple Deprivation (IMD) provide information on deprivation or poverty.
The Index of Multiple Deprivation combines a number of indicators, chosen to cover a range of economic, social and housing issues, into a single deprivation score for each small area in England. This allows each area to be ranked relative to one another according to their level of deprivation. The Index of Multiple Deprivation covers the following seven fields:
Income Deprivation
Employment Deprivation
Health and Disability Deprivation
Education and Skills Deprivation
Barriers to Services and Housing Deprivation
Crime Deprivation
Living Environment Deprivation
Information on the IMD scores for the NP and IMD maps – Health Deprivation and Disability |
Map 8.1
Population distribution within the National Park
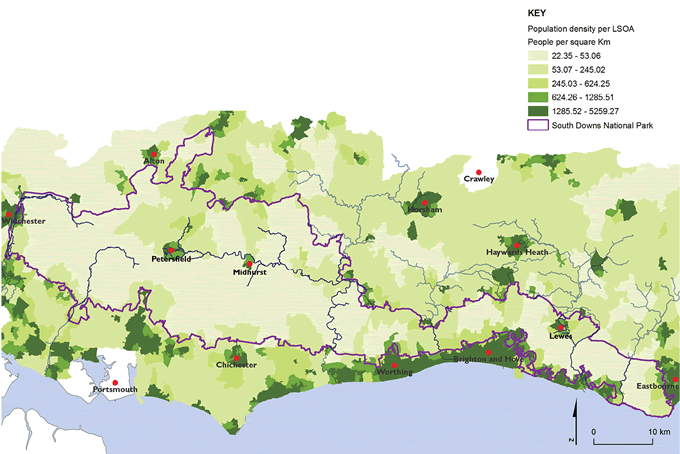
Maps prepared by: GeoSpec, University of Brighton; February 2012.
Source: The Department for Communities and Local Government, 2010
Ordnance Survey Crown Copyright © Licence No. 100050083.
Map 8.2 shows how the Indices of Multiple Deprivation are represented across the National Park. Areas of deprivation tend to occur near urban areas or in areas around the main market towns. The majority of the National Park is in the 20 per cent least deprived areas of England. Concentrated deprivation primarily exists in urban areas associated with large social housing estates, often on the fringes of major cities or towns. Most deprivation is therefore found to the south of the National Park in Brighton and Hove, Worthing and Littlehampton, with pockets in other coastal towns such as Hayling Island, Bognor Regis and Eastbourne. The dark green areas on Map 8.2 highlight the most deprived areas in the south east and, although some of those areas extend into the National Park, closer examination suggests that most deprivation is actually located in the urban areas just outside of the National Park boundary.
It should be noted that IMD data is collected and analysed at Lower Super Output Area. Because of the size of populations represented in each LSOA (1,500 persons on average), localised deprivation, especially in rural areas, is likely to be hidden and averaged out by a greater number of wealthier neighbourhoods. Therefore, it is likely that there are instances of deprivation in the National Park which are not highlighted by the IMD data.
Gypsy and traveller communities
The information available about the number of existing sites, the number of new sites required and records of any illegal encampments is currently (and historically) collected by the district and county councils (Bi-annual Caravan Count published by DCLG). This information does not separate out those inside the National Park and those outside. The nomadic lifestyle of the gypsy and traveller communities makes it difficult to collect information on how many new sites are needed within the National Park. We are working jointly with partners/adjoining local authorities to gather data which will indicate the level of need within the National Park boundary. As well as this the 2011 Census included ‘Gypsy and Traveller’ as an additional category within the section on ethnic groups. The Census information will be cut to the National Park boundary and therefore should provide further useful information.
Map 8.2
Index of Multiple Deprivation
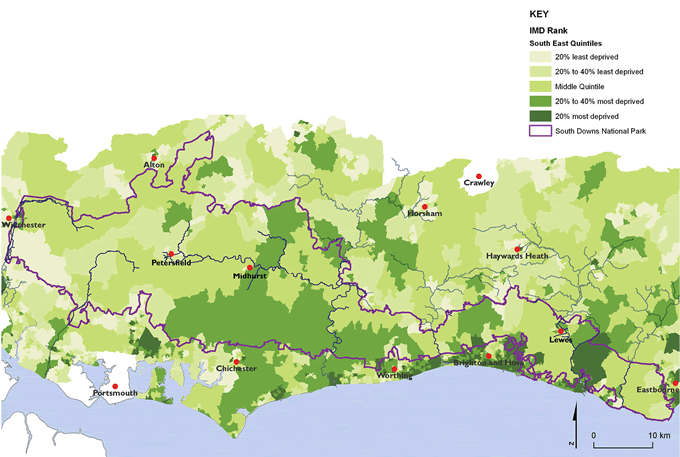
Maps prepared by: GeoSpec, University of Brighton; May 2012.
Source: The Department for Communities and Local Government, 2010
Ordnance Survey Crown Copyright © Licence No. 100050083.
Housing
The comparatively large population of the National Park creates challenges in finding places for people to continue to live in it without impacting on its special qualities.
Housing types and prices
Figure 8.5 Housing Types
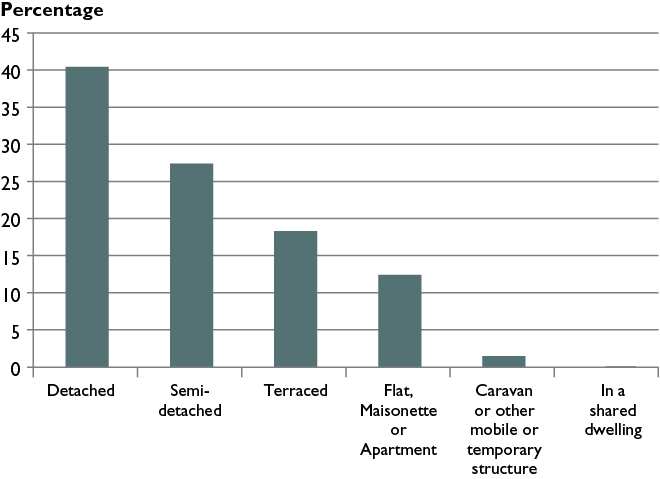
Source: Office for National Statistics (2001) Census 2001, Office for National Statistics
The high number of larger homes is a factor in the high average house prices that characterise the area and therefore the difficulty those on average or lower incomes have in buying their own homes.
Map 8.3 shows how house prices vary (using average house prices of houses sold Jan–June 2011).7 The map clearly shows how lower priced housing is mainly found along the south coast and the southern boundary of the National Park.
|
|
Key facts: Housing |
|
There are roughly 50,000 homes in the National Park (2001). |
|
|
40 per cent detached. |
|
|
27 per cent semi-detached. |
|
|
House prices are highest in the western part of the National Park – in the Winchester City, East Hampshire and Chichester Districts. |
|
|
There is a significant difference in price between the towns and their surrounding rural areas in the National Park. The average rural house price is £400,300, while in the towns it is £265,400. |
|

Affordability
The ‘affordability ratio’ indicates how many average annual salaries (national average) it costs to buy an average priced house (national average) in a given area. In 2010 the average English ratio was 7.0, while the south east region was 8.2. Eastbourne Borough is the only area in the National Park where houses are closer to the national average (at 7.1). The other 11 districts have a much lower housing affordability for residents of:
East Hampshire – 11 times the average annual salary;
Chichester – 10.5 times the average annual salary; and
Winchester – 10.2 times the average annual salary.
In general, housing is more affordable outside the National Park to the south in places such as Worthing, Eastleigh and Havant, whereas to the north it is far higher, reflecting proximity to London and the M25 corridor.8
With relatively high house prices and jobs that tend to be lower paid, it can be difficult for people to live and work in the National Park. This impacts on the availability of people to fill lower paid jobs and means increased traffic moving through the National Park. (See the Transport Fact File for more information.)
For a detailed picture of housing affordability across the National Park. |
Household composition
The household composition of the National Park is broadly similar to the south east region:
49 per cent of households are couple households (47 in the south east)
16 per cent are one person pensioner households (17 in the south east)
12 per cent are other single households (14 in the south east)
Public consultation has highlighted concerns that many large homes are under-occupied, with only one or two people living in homes which could accommodate a large family. The data collected on household composition does reveal that there are a high proportion of single and couple households and, given the proportion of detached and semi detached homes, it may be that under-occupation is an issue for parts of the National Park.
We need data on under-occupation of homes. |
Figure 8.6 Comparison of household composition
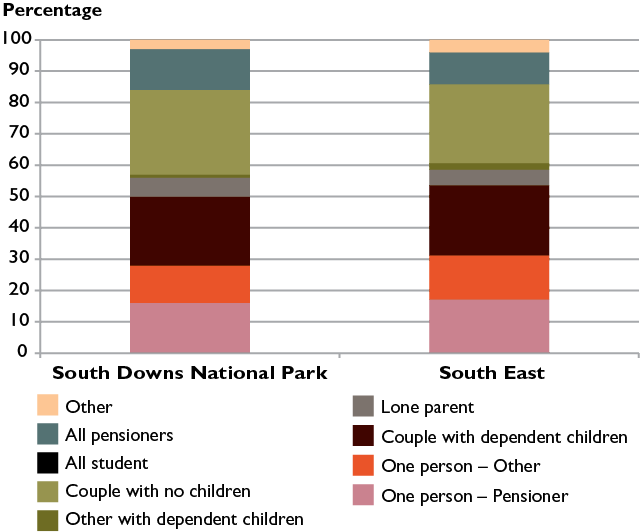
Source: Office for National Statistics (2001) Census 2001, Office for National Statistics
Housing need
Given the high proportion of larger houses and the associated high prices of housing, access to affordable housing is a key issue facing many local communities. Young people and young families, in particular, find it difficult to get low-cost housing and therefore to continue living in the area.
Map 8.3
Average house price by district
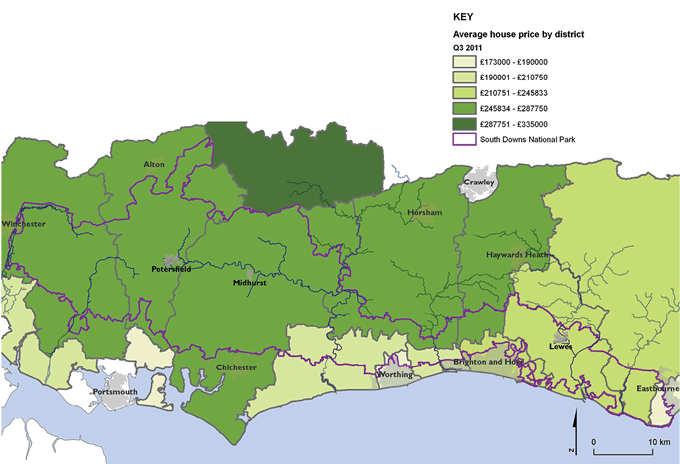
Maps prepared by: GeoSpec, University of Brighton; February 2012.
Source: Housing Requirements Study, South Downs National Park Authority, 2011
Ordnance Survey Crown Copyright © Licence No. 100050083.
There were 3780 households on housing waiting lists in 2010 which represents 7 per cent of all households in the National Park. It is important to note that the housing needs waiting list is not always a good indication of urgent housing need. It is also important to remember that numbers on waiting lists in individual authorities can fluctuate significantly year on year if authorities undertake reviews, for example. The numbers on waiting lists in almost all of the authorities within the National Park have increased over the last three years.9
Homelessness
There were an estimated 56 homeless households in the National Park in 2010, with the majority to be found in East Hampshire, Chichester and Lewes. Local authorities often use this data as a clear indicator of monitoring changes in housing need in a particular area.10 The term homelessness is often considered only to apply to people ‘sleeping rough’, however most statistics on homelessness relate to statutory homeless individuals.
For more information on homelessness. |
Empty homes
There is currently no data available on the number of empty homes in the National Park. However, using statistics provided by the Department for Communities and Local Government Housing Strategy Statistics report an empty homes figure has been established for the South Downs buffer. In 2011, there were around 23,000 empty homes in the buffer area (approximately 2.5 per cent of the homes in Sussex and Hampshire), this is an increase of more than 2 per cent from 2008 figures.
We need data on the number of empty homes. |
Holiday homes and second home ownership
Data is being collected to establish the current position regarding second home ownership in the South Downs National Park. This report will be updated when data is available.
We need data on the number of second and holiday homes. |
New development
An estimated 2500 new homes have been built in the National Park area since 2001, an average of approximately 250 per year. This is based on analysis of data provided by local authorities, although it has been necessary to make some assumptions about whether housing recorded as being provided in a ward or parish should be included or excluded as it may be that a development occurred in a ward or parish, but outside of the National Park boundary.11
Housing supply
In 2001, 74 per cent of homes were owner occupied, with 14 per cent being privately rented and 12 per cent socially rented (approximately 6000 homes). It is difficult to show how the proportion of socially rented accommodation has changed over time as there are currently only records from the 2001 Census. It is important to highlight here that housing need is not met wholly by the development of new housing.
Figure 8.7 Tenure composition in the National Park
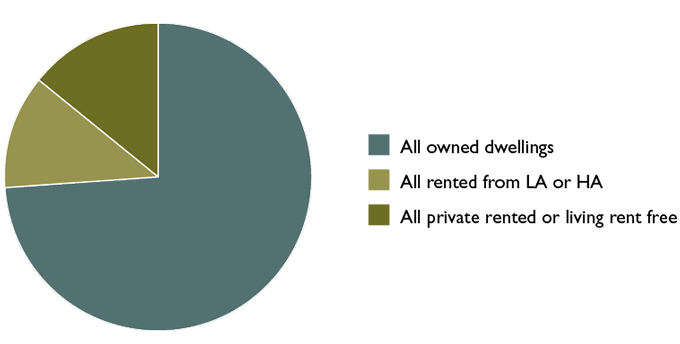
Source: Office for National Statistics (2001) Census 2001, Office for National Statistics
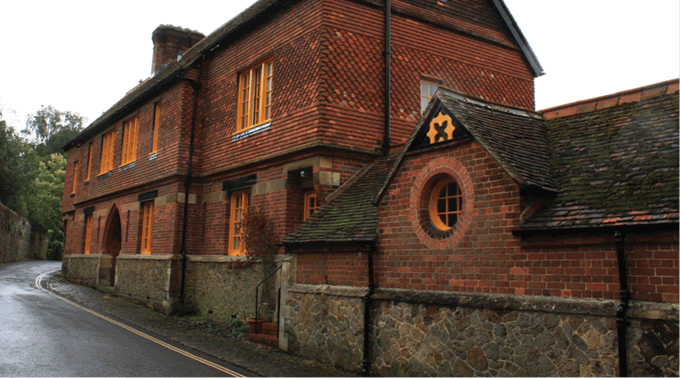
Cowdray Estate houses in Midhurst © Rebecca Saunders/SDNPA
Although housing need appears to have outstripped housing development there are other opportunities for people who wish to move to or remain living in the National Park, such as privately rented accommodation. The provision of such accommodation through the larger estates who rent to farm workers and people living locally is particularly important in the National Park. The provision of private rented accommodation is difficult to predict or analyse given the constant change in vacancies. The average cost of renting a home across the South Downs National Park is £1130 per month. This is an average across the three counties and Brighton and Hove, and provides an average rental price across all types and size of housing.
For more information on rental prices. |
The supply of socially rented housing is managed across the National Park by a range of housing associations working in partnership with the relevant local authority. There are currently over 20 main associations working on the provision of socially rented accommodation.
For more details of these providers. |
Provision of sheltered accommodation
Given the projections for an ageing population in the National Park, the provision of sheltered or supported accommodation will become increasingly important. Currently there are an estimated 938 individual sheltered units available in the National Park buffer area.
For more detail on where these sheltered units are located. |
Fuel poverty
The rural nature of the National Park means that some homes in the area are not on the mains gas network and are therefore reliant on other sources of fuel to heat their home. This impacts on the number of homes which are classified as ‘fuel poor’. A household is considered to be ‘fuel poor’ if it needs to spend more than 10 per cent of household income on fuel to maintain a satisfactory level of heating (21 degrees for the main living area and 18 degrees for other occupied rooms).
Figure 8.8 clearly shows that the majority of the National Park has at least some households living in fuel poverty. Map 8.4 shows that the highest instances of fuel poverty occur in the Chichester, Arun and Horsham Districts. There are smaller pockets of fuel poverty in the districts of Lewes and Wealden.
Figure 8.8 Fuel poverty
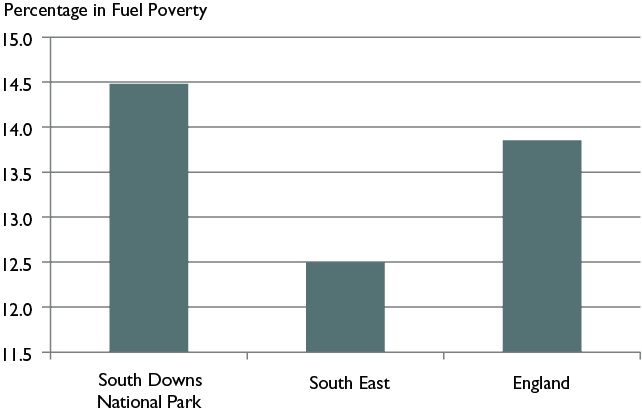
When compared to the south east region and England as a whole it becomes apparent that the percentage of homes in fuel poverty is higher in the South Downs National Park (14.5 per cent compared with 12.5 per cent in the south east).
Rural crime
The community consultation exercises carried out throughout the National Park identified rural crime as a concern for sections of the community, in particular, land managers. The majority of the National Park is in the 20 per cent of the country least affected by crime, with crime being more of an issue in the surrounding urban areas. However, this may be only a reflection of the types of crime assessed by the Indices of Multiple Deprivation, and the level of reporting in rural areas.
Indices of Multiple Deprivation Scores for crime are calculated using reported violent crimes, burglary, theft and criminal damage. Indices of Multiple Deprivation Scores for crime shows that incidents are not common in the National Park but pockets of crime do exist in certain areas within and surrounding it.
The Multiple Deprivation Scores for crime can be seen in the suite of IMD maps. |
In discussions with Hampshire and Sussex Police Constabularies, it is apparent that the key rural crimes affecting the National Park are environmental anti-social behaviour, which includes fly-tipping and littering. Other rural crimes include inappropriate use of rights of way, illegal use of private land, farm equipment theft, fuel theft, poaching and vehicle crime.
More specific analysis is needed to understand the key rural crime issues. Data is not readily available, and where it is, it is not easily comparable across the two police authorities operating in the National Park.
We need data on incidents of rural crime. |
Work is continuing with these police authorities to create an accurate record of rural crime rates in the National Park. These will be reported when available and monitored to indicate any changes.
Map 8.4
Fuel poverty
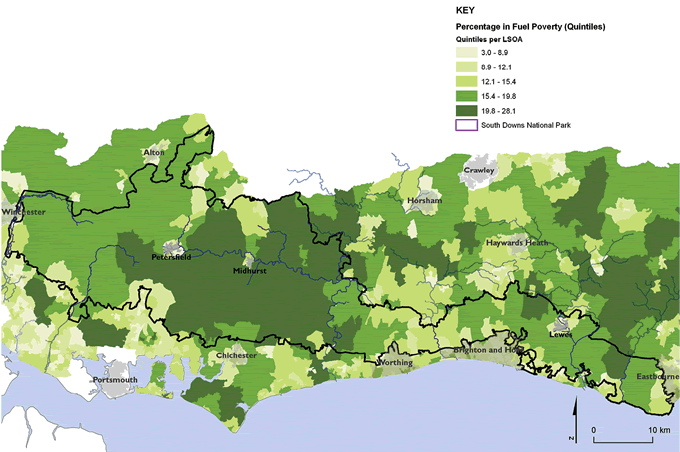
Maps prepared by: GeoSpec, University of Brighton; February 2012.
Source: Department for Energy and Climate Change, 2009
Ordnance Survey Crown Copyright © Licence No. 100050083.
Services in communities
The majority of the National Park is in the 20 per cent most deprived areas in the country for access to services and housing.
The Multiple Deprivation Scores for barriers to services and housing can be seen in the suite of IMD maps. |
Many of the communities in the National Park have seen a general decline in community facilities such as the post office, general store, pub or school. The availability of these services is often a good indicator of the sustainability of a community and, therefore, its viability as a place to live. Accessing essential services is very challenging for those who do not live close to a market town or major settlement. Analysis of Community Led Plans such as Parish Plans and Market Town Healthchecks clearly shows that the loss of community facilities is a key concern for local people.
It is also apparent that accessing key local services and housing is an issue that goes beyond the National Park boundary, although it seems to be less of an issue along the south coast.
Given the rural nature of the National Park, communities are turning to high speed internet connections to access services such as banking, grocery shopping and, occasionally health care. However, limited high speed internet access makes this method of accessing services challenging. More detail on the availability of high speed internet can be found in Chapter 5.
We are carrying out a Settlement Hierarchy Study to provide more specific data on community access to key services. This study will establish exactly which facilities exist in each community – such as post offices, supermarkets or general stores, pubs, primary schools and village halls. We will then compare this data to south east regional averages where data is available.
Active communities
The communities in the National Park take real pride in their towns and villages, and many of them dedicate time and resources to enhancing community life, conserving what is important to their local area and planning for the needs of future generations.
Communities will often use community planning exercises such as Parish Plans, neighbourhood plans, village design statements and Local Landscape Character Assessments (LLCA), local biodiversity action plans, and conservation area appraisals to assess community life and develop action plans to tackle local issues.
Currently there are 97 communities who have carried out or are carrying out a community planning exercise of one type or another. This is equivalent to 54 per cent of communities in the National Park. Map 8.5 clearly shows the level of active community planning across the National Park.
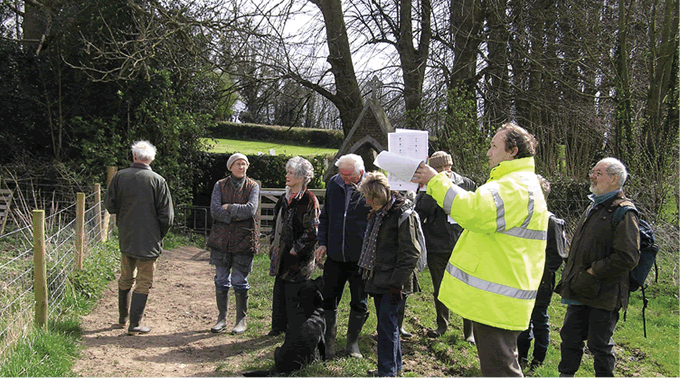
A community discussing a Community Led Plan © SDNPA
With our partners we will monitor the number of community-led planning exercises to measure the level of local action in improving quality of life for residents and visitors. We will also monitor the use of our resources in supporting the development and delivery of community-led planning exercises. This will enable us and our partners to assess the level of support that is being committed to fostering the social and economic well-being of the communities in the National Park.
Local Landscape Character Assessments are of particular interest to us as these exercises ask local communities to assess and value the landscape in which they live. This information can be used to provide a comprehensive understanding of the value local communities place on their surroundings.
Map 8.5
Community planning activity in the National Park
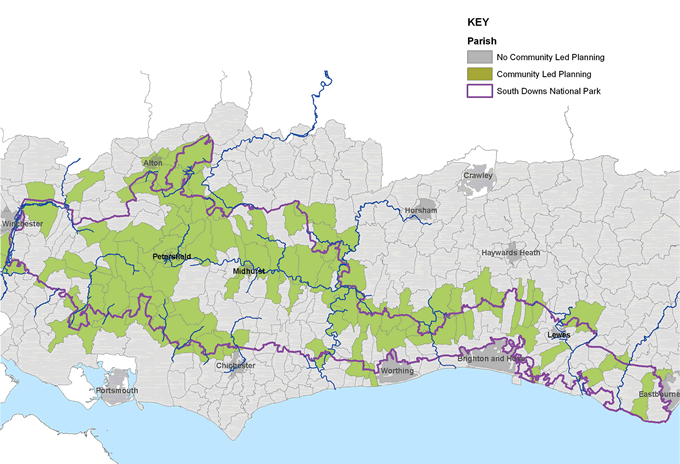
Maps prepared by: GeoSpec, University of Brighton; May 2012.
Source: South Downs Community Consultation Review, South Downs National Park Authority, 2012
Ordnance Survey Crown Copyright © Licence No. 100050083.
|
Key data: Distinctive towns and villages, and communities with real pride in their area Population density The National Park Authority, with its partners, will monitor changes in the population density of the National Park: Key data: The population density of the National Park, measured in the number of people per km2. Current position: 70 people per km2.. Data source: Office for National Statistics (2009) Mid year population estimates, Office for National Statistics Responsibility for data collection: ONS.
Population age The National Park Authority, with its partners, will monitor changes in the age profile of the population of the National Park: Key data: The age profile of the National Park population. Current position: 0–14 17 per cent, 15–64 61 per cent, 65+ 21 per cent. Data source: Office for National Statistics (2009) Mid year population estimates, Office for National Statistics Responsibility for data collection: ONS.
Housing affordability The National Park Authority, with its partners, will monitor changes in household affordability: Key data: The number of average annual salaries needed to purchase an average priced house. Current position: 9.5 times the average annual salary. Data source: Community and Local Government Live Table (March 2012) Table 577- District Level, The Department for Communities and Local Government Responsibility for data collection: DCLG.
Services in communities The National Park Authority, with its partners, will monitor changes in the key services available in communities across the National Park: Key data: the proportion of communities with access to a post office, supermarket or general store, pub, primary school and village hall in their community; and the proportion of communities with access to a post office, supermarket or general store, pub, primary school and village hall within 2km of their community. Current position: Unknown. Data source: South Downs National Park Authority, South Downs National Park Settlement Hierarchy Study, South Downs National Park Authority Responsibility for data collection: South Downs National Park Authority.
Active communities The National Park Authority, with its partners, will monitor the number of community led planning exercises being prepared or completed in the National Park. The National Park Authority will also monitor the level of NPA resources used to support the delivery of Community Led Plans: Key data: the proportion of communities with a complete plan or preparing a community-led plan; the proportion of Sustainable Community Fund Grants which contribute to the delivery of projects identified through community-led plan; the proportion of communities with a complete or preparing a Local Landscape Character Assessment. Current position: the proportion of communities with a complete or preparing a community-led plan: 54 per cent; the proportion of Sustainable Community Fund Grants which contribute to the delivery of projects identified through community-led plan: unknown; the proportion of communities with a complete or preparing a Local Landscape Character Assessment: 3 per cent (6 communities). Data source: South Downs National Park Authority (2012) South Downs National Park Community Led Planning Database, South Downs National Park Authority Responsibility for data collection: Rural Community Councils (Action in Rural Sussex or Community Action Hampshire) and South Downs National Park Authority.
|
Footnotes
Click on the footnote number to take you back to your place in the document.
1 South Downs National Park Authority (2011) Special Qualities of the South Downs National Park, SDNPA
3 Hampshire County Council (2011) South Downs National Park Local Economy: Current Economic Indicators for the Local Economy of the South Downs National Park, Hampshire County Council
4 Hampshire County Council (2011) South Downs National Park Local Economy: Current Economic Indicators for the Local Economy of the South Downs National Park, Hampshire County Council
5 The largest increase between 2001 and 2009 was recorded for those aged 60–64 (26 per cent), with increases also recorded in the over 85 (17 per cent), 45–49 group (14 per cent) and those aged 80–85 (11 per cent). This reinforces the National Park’s population bias towards older people. The largest decrease was recorded in those aged 30–34 (-39 per cent) and 35–39 (-19 per cent). The population aged 15–19 increased by 12 per cent, which might be associated with the increase in those aged 45–49 as family households
6 Hampshire County Council (2011) South Downs National Park Local Economy: Current Economic Indicators for the Local Economy of the South Downs National Park, Hampshire County Council
7 Based on Land Registry data
8 HCC Report (2011) South Downs National Park Local Economy: Current Economic Indicators for the Local Economy of the South Downs National Park
9 South Downs National Park Authority (2011) South Downs National Park Housing Requirements Study, SDNPA
10 Ibid
11 Ibid