MENE data
Visits Previous Year Demographic
Visits General
Visits to general places in the South Downs National Park area: MENE 2009-2012 - weighted 000's
|
|
Frequency |
Percent |
|
|
General Place |
In the countryside |
97,165 |
51.0 |
|
In a town or city |
47,883 |
25.1 |
|
|
In a seaside resort or town |
29,640 |
15.6 |
|
|
Other seaside coastline |
15,799 |
8.3 |
|
|
Total |
190,487 |
100.0 |
|
Note: only includes respondents from the SDNP study area who took visits to the SDNP study area. N = 1,431.
Weighted results show there were an estimated 190 million visits taken to the SDNP study area by SDNP study area respondents during the period March 2009 to February 2012.
Visits to general places in the South Downs National Park area: MENE 2009-2012 - unweighted
|
|
Frequency |
Percent |
|
|
General Place |
In the countryside |
636 |
44.4 |
|
In a town or city |
348 |
24.3 |
|
|
In a seaside resort or town |
330 |
23.1 |
|
|
Other seaside coastline |
117 |
8.2 |
|
|
Total |
1,431 |
100.0 |
|
Note: only includes respondents from the SDNP study area who took visits to the SDNP study area. N = 1,431.
The unweighted profile is similar, apart from a greater proportion of visits to seaside resorts and towns. The overall sample size however makes the weighted figures reliable to use.
Visits Specific
Visits to specific places in the South Downs National Park area: MENE 2009-2012 - weighted 000's
|
|
|
Frequency |
Percent |
|
Specific Place |
Woodland |
35,572 |
18.7 |
|
Park in a town or city |
28,447 |
14.9 |
|
|
Beach |
24,966 |
13.1 |
|
|
Playing field |
20,333 |
10.7 |
|
|
Paths, cycleways or bridleways |
20,188 |
10.6 |
|
|
Open space in the countryside |
17,769 |
9.3 |
|
|
Farmland |
12,473 |
6.5 |
|
|
Country Park |
11,161 |
5.9 |
|
|
Rivers or streams |
10,368 |
5.4 |
|
|
Coastline |
9,169 |
4.8 |
|
|
Open space in a town |
9,157 |
4.8 |
|
|
Village |
8,937 |
4.7 |
|
|
Playground |
5,502 |
2.9 |
|
|
Mountain, hill or moorland |
3,502 |
1.8 |
|
|
Allotment |
199 |
0.1 |
Note: only includes respondents from the SDNP study area who took visits to the SDNP study area. Sum of totals is more than 100% as visits could have included more than one type of place. N = 1,431.
Weighted results should be used with caution given the low sample sizes associated with some of the places in the table (see unweighted results below).
Visits to specific places in the South Downs National Park area: MENE 2009-2012 – unweighted
|
|
Frequency |
Percent |
|
|
Specific Place |
Park in a town or city |
223 |
15.6 |
|
Beach |
223 |
15.6 |
|
|
Woodland |
181 |
12.6 |
|
|
Playing field |
132 |
9.2 |
|
|
Paths, cycleways or bridleways |
129 |
9.0 |
|
|
Open space in the countryside |
111 |
7.8 |
|
|
Country Park |
104 |
7.3 |
|
|
Coastline |
101 |
7.1 |
|
|
Rivers or streams |
79 |
5.5 |
|
|
Village |
69 |
4.8 |
|
|
Open space in a town |
67 |
4.7 |
|
|
Farmland |
63 |
4.4 |
|
|
Playground |
61 |
4.3 |
|
|
Mountain, hill or moorland |
22 |
1.5 |
|
|
Allotment |
3 |
.2 |
Note: only includes respondents from the SDNP study area who took visits to the SDNP study area. Sum of totals is more than 100% as visits could have included more than one type of place. N = 1,431.
Beaches figure prominently in the results - perhaps unsurprising given the prevalence of coastline in the study ares..
Visits Activities
Activities undertaken during visits to the South Downs National Park area: MENE 2009-2012 - weighted 000's
|
|
|
Frequency |
Percent |
|
Activity |
Walking without a dog |
24,011 |
36.1 |
|
Walking with a dog |
19,216 |
28.9 |
|
|
Playing with children |
7,405 |
11.1 |
|
|
Eating or drinking out |
5,208 |
7.8 |
|
|
Visiting an attraction |
3,793 |
5.7 |
|
|
Running |
2,754 |
4.1 |
|
|
Informal games and sport |
2,739 |
4.1 |
|
|
Beach activites |
2,444 |
3.7 |
|
|
Picnicking |
1,646 |
2.5 |
|
|
Road cycling |
1,606 |
2.4 |
|
|
Enjoying scenery |
1,602 |
2.4 |
|
|
Watching wildlife |
1,531 |
2.3 |
|
|
Off road cycling |
1,118 |
1.7 |
|
|
Swimming |
809 |
1.2 |
|
|
Horse riding |
618 |
0.9 |
|
|
Fishing |
363 |
0.5 |
|
|
Water sports |
253 |
0.4 |
|
|
Field sports |
144 |
0.2 |
|
|
Off road driving |
121 |
0.2 |
Note: only includes respondents from the SDNP study area who took visits to the SDNP study area. Sum of totals is more than 100% as visits could have included more than one type of activity. N = 1,431.
Again low underlying sample sizes (see below) mean the weighted volumes of visits for all activities undertaken should be treated with caution.
Activities undertaken during visits to the South Downs National Park area: MENE 2009-2012 - unweighted
|
|
|
Frequency |
Percent |
|
Activity |
Walking without a dog |
525 |
36.7 |
|
Walking with a dog |
398 |
27.8 |
|
|
Playing with children |
168 |
11.7 |
|
|
Eating or drinking out |
112 |
7.8 |
|
|
Visiting an attraction |
86 |
6.0 |
|
|
Informal games and sport |
58 |
4.1 |
|
|
Running |
51 |
3.6 |
|
|
Beach activities |
48 |
3.4 |
|
|
Enjoying scenery |
37 |
2.6 |
|
|
Picnicking |
34 |
2.4 |
|
|
Watching wildlife |
34 |
2.4 |
|
|
Road cycling |
33 |
2.3 |
|
|
Off road cycling |
21 |
1.5 |
|
|
Swimming |
18 |
1.3 |
|
|
Horse riding |
13 |
.9 |
|
|
Fishing |
8 |
.6 |
|
|
Water sports |
6 |
.4 |
|
|
Field sports |
3 |
.2 |
|
|
Off road driving |
3 |
.2 |
Note: only includes respondents from the SDNP study area who took visits to the SDNP study area. Sum of totals is more than 100% as visits could have included more than one type of activity. N =1,431.
Walking, playing with children and eating and drinking out emerged as the top activities, a finding that is consistent with those from the national survey.
Visits Timeseries
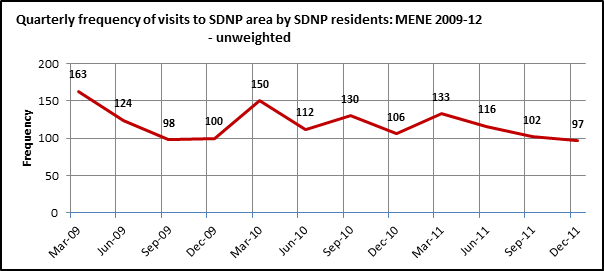
Visits to the South Downs National Park area by quarter: MENE 2009-2012 - unweighted
|
|
|
Frequency |
|
Quarter beginning |
Mar-09 |
163 |
|
Jun-09 |
124 |
|
|
Sep-09 |
98 |
|
|
Dec-09 |
100 |
|
|
Mar-10 |
150 |
|
|
Jun-10 |
112 |
|
|
Sep-10 |
130 |
|
|
Dec-10 |
106 |
|
|
Mar-11 |
133 |
|
|
Jun-11 |
116 |
|
|
Sep-11 |
102 |
|
|
Dec-11 |
97 |
|
|
Total |
1,431 |
Note: only includes respondents from the SDNP study area who took visits to the SDNP study area. N = 1,431.
Quarterly sample sizes mean it is difficult to detect with any certainty, any definitive effect on the numbers visiting the park after the changes at the latter end of 2009.
Visits Previous Year
General propenstiy to visit the natural environment over the previous year - SDNP residents: MENE 2009-2012 - unweighted
|
|
Frequency |
Percent |
|
|
Visits |
More than once per day |
17 |
2.1 |
|
Every day |
94 |
11.9 |
|
|
Several times a week |
275 |
34.7 |
|
|
Once a week |
179 |
22.6 |
|
|
Once or twice a month |
117 |
14.8 |
|
|
Once every 2-3 months |
35 |
4.4 |
|
|
Once or twice |
43 |
5.4 |
|
|
Never |
32 |
4.0 |
|
|
Total |
792 |
100.0 |
|
Note: only includes respondents from the SDNP study area. N = 792.
General propenstiy to visit over the previous year - South Downs National Park residents: MENE 2009-2012 - unweighted
|
|
Frequency |
Percent |
|
|
Visits |
Frequent |
565 |
71.3 |
|
Infrequent |
195 |
24.6 |
|
|
Non-participants |
32 |
4.0 |
|
Note: only includes respondents from the SDNP study area. Categories formed as follows: "Frequent" = visit at least once per week; "Infrequent" = visit once or twice a month, once every 2-3 months, or once or twice; "Never" = no visits. N = 792.
Almost three quarters of SDNP respondents claimed to have visited the natural environment at least once a week, but four percent claimed not to have taken visits over the previous year at all.
Visits Previous Year Demographic
General frequency of visits to the natural environment by gender: MENE 2009-12 - unweighted
|
|
Frequency |
Total |
||||
|
Frequent |
Infrequent |
Non-participants |
||||
|
Gender |
Male |
Count |
255 |
97 |
15 |
367 |
|
% within Gender |
69.5 |
26.4 |
4.1 |
100.0 |
||
|
Female |
Count |
310 |
98 |
17 |
425 |
|
|
% within Gender |
72.9 |
23.1 |
4.0 |
100.0 |
||
|
Total |
Count |
565 |
195 |
32 |
792 |
|
|
% within Gender |
71.3 |
24.6 |
4.0 |
100.0 |
||
Note: only includes respondents from the SDNP study area. N=792.
No differences between the gender profile for general propensity to visit the natural environment amongst SDNP respondents.
General frequency of visits to the natural environment by age: MENE 2009-12 - unweighted
|
|
Frequency |
Total |
||||
|
Frequent |
Infrequent |
Non-participants |
||||
|
Age |
16-24 |
Count |
82 |
18 |
1 |
101 |
|
% within Age |
81.2 |
17.8 |
1.0 |
100.0 |
||
|
25-34 |
Count |
79 |
25 |
2 |
106 |
|
|
% within Age |
74.5 |
23.6 |
1.9 |
100.0 |
||
|
35-44 |
Count |
107 |
20 |
0 |
127 |
|
|
% within Age |
84.3 |
15.7 |
.0 |
100.0 |
||
|
45-54 |
Count |
76 |
31 |
3 |
110 |
|
|
% within Age |
69.1 |
28.2 |
2.7 |
100.0 |
||
|
55-64 |
Count |
84 |
35 |
4 |
123 |
|
|
% within Age |
68.3 |
28.5 |
3.3 |
100.0 |
||
|
65+ |
Count |
137 |
66 |
22 |
225 |
|
|
% within Age |
60.9 |
29.3 |
9.8 |
100.0 |
||
|
Total |
Count |
565 |
195 |
32 |
792 |
|
|
% within Age |
71.3 |
24.6 |
4.0 |
100.0 |
||
Note: only includes respondents from the SDNP study area. N=792.
Younger age groups more likely to be frequent visitors; older age groups more likely to be non-participants. Beware of very low sample sizes in some of the cells however.
General frequency of visits to the natural environment by Social Grade: MENE 2009-12 - unweighted
|
|
Frequency |
Total |
||||
|
Frequent |
Infrequent |
Non-participants |
||||
|
Social Grade |
AB |
Count |
170 |
35 |
8 |
213 |
|
% within SEG |
79.8 |
16.4 |
3.8 |
100.0 |
||
|
C1 |
Count |
175 |
60 |
3 |
238 |
|
|
% within SEG |
73.5 |
25.2 |
1.3 |
100.0 |
||
|
C2 |
Count |
115 |
45 |
5 |
165 |
|
|
% within SEG |
69.7 |
27.3 |
3.0 |
100.0 |
||
|
DE |
Count |
105 |
55 |
16 |
176 |
|
|
% within SEG |
59.7 |
31.3 |
9.1 |
100.0 |
||
|
Total |
Count |
565 |
195 |
32 |
792 |
|
|
% within SEG |
71.3 |
24.6 |
4.0 |
100.0 |
||
Note: only includes respondents from the SDNP study area. N=792.
Relationship between Social Grade and general tendency to visit the natural environment is evident. Again low sample sizes especially in the non-participant category hamper analysis.
General frequency of visits to the natural environment by working status: MENE 2009-12 - unweighted
|
|
Frequency |
Total |
||||
|
Frequent |
Infrequent |
Non-participants |
||||
|
Working status |
Full time |
Count |
213 |
82 |
3 |
298 |
|
% within WORKING STATUS |
71.5 |
27.5 |
1.0 |
100.0 |
||
|
Part time |
Count |
77 |
15 |
4 |
96 |
|
|
% within WORKING STATUS |
80.2 |
15.6 |
4.2 |
100.0 |
||
|
Retired |
Count |
164 |
72 |
22 |
258 |
|
|
% within WORKING STATUS |
63.6 |
27.9 |
8.5 |
100.0 |
||
|
In Education |
Count |
40 |
7 |
0 |
47 |
|
|
% within WORKING STATUS |
85.1 |
14.9 |
.0 |
100.0 |
||
|
Not working |
Count |
71 |
19 |
3 |
93 |
|
|
% within WORKING STATUS |
76.3 |
20.4 |
3.2 |
100.0 |
||
|
Total |
Count |
565 |
195 |
32 |
792 |
|
|
% within WORKING STATUS |
71.3 |
24.6 |
4.0 |
100.0 |
||
Note: only includes respondents from the SDNP study area. N=792.
General frequency of visits to the natural environment by disability: MENE 2009-12 - unweighted
|
|
Frequency |
Total |
||||
|
Frequent |
Infrequent |
Non-participants |
||||
|
Disability |
Yes |
Count |
79 |
57 |
14 |
150 |
|
% within DISABILITY |
52.7 |
38.0 |
9.3 |
100.0 |
||
|
No |
Count |
486 |
138 |
18 |
642 |
|
|
% within DISABILITY |
75.7 |
21.5 |
2.8 |
100.0 |
||
|
Total |
Count |
565 |
195 |
32 |
792 |
|
|
% within DISABILITY |
71.3 |
24.6 |
4.0 |
100.0 |
||
Note: only includes respondents from the SDNP study area. N=792.
Relationship between disability status and general tendency to visit the natural environment is evident. Again low sample sizes especially in the non-participant category hamper analysis.
General frequency of visits to the natural environment by presence of children in the household: MENE 2009-12 - unweighted
|
|
Frequency |
Total |
||||
|
Frequent |
Infrequent |
Non-participants |
||||
|
Children in household |
Any |
Count |
168 |
33 |
2 |
203 |
|
% within CHILDREN IN H/HOLD |
82.8 |
16.3 |
1.0 |
100.0 |
||
|
None |
Count |
397 |
162 |
30 |
589 |
|
|
% within CHILDREN IN H/HOLD |
67.4 |
27.5 |
5.1 |
100.0 |
||
|
Total |
Count |
565 |
195 |
32 |
792 |
|
|
% within CHILDREN IN H/HOLD |
71.3 |
24.6 |
4.0 |
100.0 |
||
Note: only includes respondents from the SDNP study area. N=792.
The presence of children in ht household generally increases the likelihood that visits will be taken frequently.
General frequency of visits to the natural environment by household size: MENE 2009-12 - unweighted
|
|
Frequency |
Total |
||||
|
Frequent |
Infrequent |
Non-participants |
||||
|
Household size |
1 |
Count |
112 |
51 |
9 |
172 |
|
% within HOUSEHOLD SIZE |
65.1 |
29.7 |
5.2 |
100.0 |
||
|
2 |
Count |
201 |
82 |
14 |
297 |
|
|
% within HOUSEHOLD SIZE |
67.7 |
27.6 |
4.7 |
100.0 |
||
|
3 |
Count |
112 |
24 |
5 |
141 |
|
|
% within HOUSEHOLD SIZE |
79.4 |
17.0 |
3.5 |
100.0 |
||
|
4 |
Count |
95 |
25 |
2 |
122 |
|
|
% within HOUSEHOLD SIZE |
77.9 |
20.5 |
1.6 |
100.0 |
||
|
5+ |
Count |
45 |
13 |
2 |
60 |
|
|
% within HOUSEHOLD SIZE |
75.0 |
21.7 |
3.3 |
100.0 |
||
|
Total |
Count |
565 |
195 |
32 |
792 |
|
|
% within HOUSEHOLD SIZE |
71.3 |
24.6 |
4.0 |
100.0 |
||
Note: only includes respondents from the SDNP study area. N=792.
General frequency of visits to the natural environment by Index of Multiple Deprivation: MENE 2009-12 - unweighted
|
|
Frequency |
Total |
||||
|
Frequent |
Infrequent |
Non-participants |
||||
|
IMD |
Bottom 10% |
Count |
11 |
3 |
0 |
14 |
|
% within IMD |
78.6 |
21.4 |
.0 |
100.0 |
||
|
Mid 11% to 89% |
Count |
407 |
152 |
25 |
584 |
|
|
% within IMD |
69.7 |
26.0 |
4.3 |
100.0 |
||
|
NA |
Count |
2 |
0 |
0 |
2 |
|
|
% within IMD |
100.0 |
.0 |
.0 |
100.0 |
||
|
Top 10% |
Count |
145 |
40 |
7 |
192 |
|
|
% within IMD |
75.5 |
20.8 |
3.6 |
100.0 |
||
|
Total |
Count |
565 |
195 |
32 |
792 |
|
|
% within IMD |
71.3 |
24.6 |
4.0 |
100.0 |
||
Note: only includes respondents from the SDNP study area. N=792.
Impossible to draw any firm conclusions since there are so few respondents from the bottom 10% IMD areas of the country in the sample.
General frequency of visits to the natural environment by ethnicity: MENE 2009-12 - unweighted
|
|
Frequency |
Total |
||||
|
Frequent |
Infrequent |
Non-participants |
||||
|
Ethnicity |
White |
Count |
547 |
190 |
30 |
767 |
|
% within White |
71.3 |
24.8 |
3.9 |
100.0 |
||
|
BME |
Count |
17 |
5 |
2 |
24 |
|
|
% within BME |
70.8 |
20.8 |
8.3 |
100.0 |
||
|
Total |
Count |
564 |
195 |
32 |
791 |
|
|
% within ethnicity |
71.3 |
24.7 |
4.0 |
100.0 |
||
Note: only includes respondents from the SDNP study area. N=792.
Impossible to draw any firm conclusions since there are so few respondents from BME groups represented in the sample.
Barriers
SDNP resident's reasons for not visiting the general natural environment more often: MENE 2009-2012 - unweighted
|
|
|
Frequency |
Percent |
|
Barriers |
Poor health |
27 |
24.5 |
|
Old age |
24 |
21.8 |
|
|
Physical disability |
22 |
20.0 |
|
|
Too busy at work |
22 |
20.0 |
|
|
Too busy at home |
15 |
13.6 |
|
|
No particular reason |
10 |
9.1 |
|
|
Not interested |
8 |
7.3 |
|
|
Other caring responsibility |
8 |
7.3 |
|
|
Prefer other leisure activities |
6 |
5.5 |
|
|
Bad/poor weather |
3 |
2.7 |
|
|
Have young children |
3 |
2.7 |
|
|
Other caring responsibility |
3 |
2.7 |
|
|
No access to a car |
3 |
2.7 |
|
|
Don't like going on my own |
2 |
1.8 |
|
|
Too expensive |
2 |
1.8 |
|
|
Pregnant |
1 |
.9 |
|
|
Not something for me |
1 |
.9 |
Note: only includes respondents from the SDNP study area. Sum of totals is more than 100% as answers could have included more than one type of barrier. Question asked of respondents whose general propensity to visit the natural environment during the previous year was once or twice a month or less often. N = 110.
Results generally consistent with those from the national survey. However, low sample sizes render analysis by demographic sub-groups unsound.
Distance Transport
Distance travelled during visits to the SDNP area: MENE 2009-12 - unweighted
|
|
Frequency |
Percent |
|
|
Distance |
Less than 1 mile |
465 |
32.5 |
|
1 or 2 miles |
441 |
30.8 |
|
|
3 to 5 miles |
242 |
16.9 |
|
|
6 to 10 miles |
151 |
10.6 |
|
|
11 to 20 miles |
78 |
5.5 |
|
|
21 to 40 miles |
43 |
3.0 |
|
|
41 to 60 miles |
10 |
.7 |
|
|
61 to 80 miles |
1 |
.1 |
|
|
Total |
1,431 |
100.0 |
|
Over three quarters of visits taken by SDNP respondents to locations in the SDNP study area are within five miles of the start point not unexpected.
Transport types used during visits to the SDNP area: MENE 2009-12 - unweighted
|
|
Frequency |
Percent |
|
|
Valid |
Car/van |
486 |
34.0 |
|
Train |
16 |
1.1 |
|
|
Public bus or coach |
41 |
2.9 |
|
|
Coach trip/private coach |
2 |
.1 |
|
|
Motorcycle/ scooter |
3 |
.2 |
|
|
Bicycle/ mountain bike |
63 |
4.4 |
|
|
On foot/ walking |
808 |
56.5 |
|
|
Wheelchair/mobility scooter |
4 |
.3 |
|
|
On horseback |
2 |
.1 |
|
|
Taxi |
1 |
.1 |
|
|
Other |
5 |
.3 |
|
|
Total |
1,431 |
100.0 |
|
The prevalence of walking as the main means of transport is not surprising given the close-to-home profile of visits seen in the table above.
Transport types used during visits to the SDNP area by distance travelled: MENE 2009-12 - unweighted
|
|
Distance |
Total |
|||||||||
|
Less than 1 mile |
1 or 2 miles |
3 to 5 miles |
6 to 10 miles |
11 to 20 miles |
(30.5) 21 to 40 miles |
41 to 60 miles |
61 to 80 miles |
||||
|
Transport |
Car/van |
Count |
33 |
109 |
123 |
112 |
64 |
37 |
7 |
1 |
486 |
|
% within Transport |
6.8 |
22.4 |
25.3 |
23.0 |
13.2 |
7.6 |
1.4 |
.2 |
100.0 |
||
|
Train (includes tube/underground) |
Count |
0 |
0 |
1 |
6 |
4 |
3 |
2 |
0 |
16 |
|
|
% within Transport |
.0 |
.0 |
6.3 |
37.5 |
25.0 |
18.8 |
12.5 |
.0 |
100.0 |
||
|
Public bus or coach (scheduled service) |
Count |
0 |
16 |
10 |
10 |
3 |
2 |
0 |
0 |
41 |
|
|
% within Transport |
.0 |
39.0 |
24.4 |
24.4 |
7.3 |
4.9 |
.0 |
.0 |
100.0 |
||
|
Bicycle/ mountain bike |
Count |
6 |
22 |
21 |
9 |
4 |
0 |
1 |
0 |
63 |
|
|
% within Transport |
9.5 |
34.9 |
33.3 |
14.3 |
6.3 |
.0 |
1.6 |
.0 |
100.0 |
||
|
On foot/ walking |
Count |
424 |
289 |
83 |
10 |
2 |
0 |
0 |
0 |
808 |
|
|
% within Transport |
52.5 |
35.8 |
10.3 |
1.2 |
.2 |
.0 |
.0 |
.0 |
100.0 |
||
|
Total |
Count |
465 |
441 |
242 |
151 |
78 |
43 |
10 |
1 |
1431 |
|
|
% within Transport |
.3 |
.3 |
.2 |
.1 |
.1 |
.0 |
.0 |
.0 |
1.0 |
||
Motivations
Visits to specific places in the South Downs National Park area: MENE 2009-2012 - unweighted
|
|
|
Frequency |
Percent |
|
Motivations |
Health or excercise |
108 |
35.9 |
|
Relax and unwind |
94 |
31.2 |
|
|
Fresh air or to enjoy pleasent weather |
80 |
26.6 |
|
|
Walk a dog |
80 |
26.6 |
|
|
Enjoy scenery |
68 |
22.6 |
|
|
Entertain children |
51 |
16.9 |
|
|
Spend time with family |
49 |
16.3 |
|
|
Spend time with friends |
41 |
13.6 |
|
|
Be somewhere I like |
41 |
13.6 |
|
|
Peace and quiet |
40 |
13.3 |
|
|
Watch wildlife |
30 |
10.0 |
|
|
Challenege myself |
17 |
5.6 |
|
|
Other |
10 |
3.3 |
|
|
To learn something new |
5 |
1.7 |
Note: only includes respondents from the SDNP study area who took visits to the SDNP study area. Sum of totals is more than 100% as visits could have included more than one type of motivation.
Visiting for reasons of well-being features prominently in the motivations for visit-taking. Dog walking as a motivation is around half that which appears in the national survey (usually around half of all visits are motivated by the need to exercise a dog).
Outcomes
Outcomes of visits taken to SDNP area: MENE 2009-12 - unweighted
|
I enjoyed it |
Frequency |
Percent |
Cumulative Percent |
|
|
Response |
Strongly agree |
55 |
48.2 |
48.2 |
|
Agree |
58 |
50.9 |
99.1 |
|
|
Neither agree nor disagree |
1 |
.9 |
100.0 |
|
|
Total |
114 |
100.0 |
|
|
Note: only includes respondents from the SDNP study area who took visits to the SDNP study area. N = 114
Outcomes of visits taken to SDNP area: MENE 2009-12 - unweighted
|
It made me feel calm and relaxed |
Frequency |
Valid Percent |
Cumulative Percent |
|
|
Response |
Strongly agree |
36 |
31.6 |
31.6 |
|
Agree |
68 |
59.6 |
91.2 |
|
|
Neither agree nor disagree |
7 |
6.1 |
97.4 |
|
|
Disagree |
2 |
1.8 |
99.1 |
|
|
Strongly disagree |
1 |
.9 |
100.0 |
|
|
Total |
114 |
100.0 |
|
|
Note: only includes respondents from the SDNP study area who took visits to the SDNP study area. N = 114
Outcomes of visits taken to SDNP area: MENE 2009-12 - unweighted
|
It made me feel refreshed and revitalised |
Frequency |
Valid Percent |
Cumulative Percent |
|
|
Response |
Strongly agree |
32 |
28.1 |
28.1 |
|
Agree |
68 |
59.6 |
87.7 |
|
|
Neither agree nor disagree |
8 |
7.0 |
94.7 |
|
|
Disagree |
5 |
4.4 |
99.1 |
|
|
Strongly disagree |
1 |
.9 |
100.0 |
|
|
Total |
114 |
100.0 |
|
|
Note: only includes respondents from the SDNP study area who took visits to the SDNP study area. N = 114
Outcomes of visits taken to SDNP area: MENE 2009-12 - unweighted
|
I took time to appreciate my surroundings |
Frequency |
Valid Percent |
Cumulative Percent |
|
|
Response |
Strongly agree |
40 |
35.1 |
35.1 |
|
Agree |
64 |
56.1 |
91.2 |
|
|
Neither agree nor disagree |
3 |
2.6 |
93.9 |
|
|
Disagree |
7 |
6.1 |
100.0 |
|
|
Total |
114 |
100.0 |
|
|
Note: only includes respondents from the SDNP study area who took visits to the SDNP study area. N = 114
Outcomes of visits taken to SDNP area: MENE 2009-12 - unweighted
|
I learned something new about the natural world |
Frequency |
Valid Percent |
Cumulative Percent |
|
|
Response |
Strongly agree |
9 |
7.9 |
7.9 |
|
Agree |
36 |
31.6 |
39.5 |
|
|
Neither agree nor disagree |
26 |
22.8 |
62.3 |
|
|
Disagree |
38 |
33.3 |
95.6 |
|
|
Strongly disagree |
5 |
4.4 |
100.0 |
|
|
Total |
114 |
100.0 |
|
|
Note: only includes respondents from the SDNP study area who took visits to the SDNP study area. N = 114
Outcomes of visits taken to SDNP area: MENE 2009-12 - unweighted
|
I felt close to nature |
Frequency |
Valid Percent |
Cumulative Percent |
|
|
Response |
Strongly agree |
25 |
21.9 |
21.9 |
|
Agree |
59 |
51.8 |
73.7 |
|
|
Neither agree nor disagree |
18 |
15.8 |
89.5 |
|
|
Disagree |
12 |
10.5 |
100.0 |
|
|
Total |
114 |
100.0 |
|
|
Note: only includes respondents from the SDNP study area who took visits to the SDNP study area. N = 114