For a diagrammatic version of this Fact File |
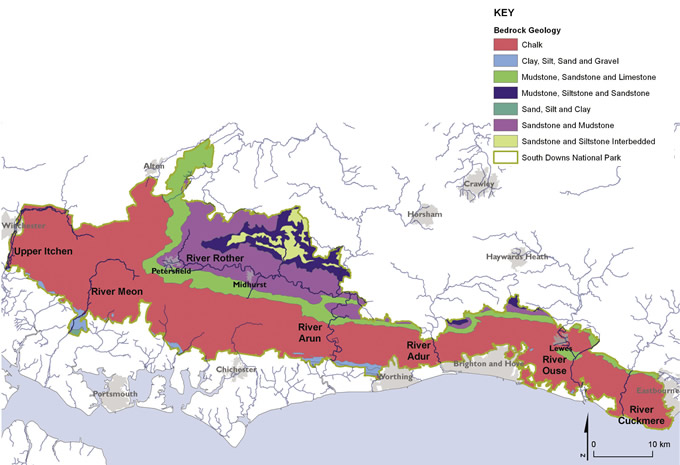
Water influences many of the special qualities of the South Downs National Park: naturally occurring high-quality freshwater is a product of the chalk and sandstone geology of the landscape; the associated aquifers and rivers support a rich and diverse array of wildlife and habitats; and sites of reliable water supply have influenced the locations of communities across the National Park, for example at Poynings and Fulking where springs issue from the scarp slope. Having a healthy water environment is therefore crucial to life in the National Park.
Environment facts:
The main rivers draining the National Park include:
River Length within Park
River Itchen 58.5km
River Rother 56.3km
River Meon 33.3km
River Arun 31.1km
River Ouse 15.8km
River Cuckmere 9.9km
River Adur 5.7km
Average rainfall across the National Park varies from 807 mm/year in the west to 879 mm/year in the east.6 Rainfall during autumn/winter ‘refills’ the aquifers supporting river flows and abstraction. Refilling usually only occurs in these seasons when evaporation rates are lower and trees are not in leaf.
Agricultural land use in the Rother Valley causes soil erosion. This impacts river water quality and ecology, contributing to the river not achieving ‘good status’ under the WFD.5
Internationally designated wildlife sites such as Chichester and Langstone Harbour Special Protection Area (SPA) depend on freshwater contributions from the chalk of the South Downs National Park to sustain habitats.
Climate change is predicted to impact water in the National Park4. Groundwater fed rivers such as the Meon could have summer flows reduced by 5–10%. Rivers with clay catchments such as the Ouse could have summer flows reduced by 30%. This would impact water resources and water quality, for example less dilution of discharges from waste water treatment works.
The chalk waters of the National Park are naturally of a very high quality. This is because the chalk filters the water and removes impurities. In areas such as Friston Forest, the land is managed sustainably to secure a high-quality drinking water supply.
Usage facts:
Abstraction for public water supply from the National Park supplies 1.2 million people. This includes the communities within the National Park, the towns and cities of the coast, and parts of north Sussex and Surrey.
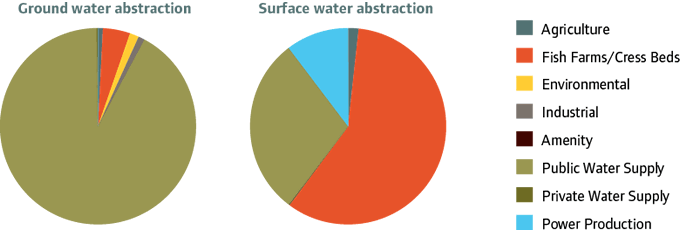
Groundwater abstraction from the National Park totals 215,190 million litres per year – or 86,076 Olympic swimming pools: 92% is for public water supply.1
Surface water abstraction from the National Park totals 125,514 million litres per year – or 50,206 Olympic swimming pools: 59% is for fish farming; 29% for public water supply.1
The population reliant on water sourced from the National Park uses an average of 170 litres per person, per day. The national average is 159 litres per person, per day.2 This high demand is reducing the amount of water available for the environment.
Ecology facts:
Ecological status of streams and rivers in the National Park:
15% good or high ecological status
- 41% poor ecological status3
Chemical status of streams and rivers in the National Park:
- 54.6% good or high chemical status
- 45.4% poor ecological status3
Chemical status of ground-water in the National Park:
- 27% good or high chemical status
- 73% poor chemical status3
Quantitative status of groundwater in the National Park:
- 10% good quantitative status
- 90% poor quantitative status3
Ecological status of estuaries in the National Park:
- 100% moderate ecological status3
Chemical status of estuaries in the National Park:
- 100% good chemical status3
Ecological status of coastal waters of the National Park:
- 100% moderate ecological status3
Chemical status of coastal waters of the National Park:
- 100% moderate chemical status3
Bathing water quality in the National Park:
- 100% of sites meet the guideline standards of the European Bathing Water Directive3
The Water Framework Directive
The European Water Framework Directive (WFD) helps protect and enhance the quality of our water environment, for example, rivers and groundwaters. The WFD classifies the status of water bodies in terms of ecology, chemistry, and for groundwaters, quantity (i.e. how much water is abstracted).
The Environment Agency is the lead authority for the WFD. However, the South Downs National Park Authority, Natural England, local water companies and River Trust are among the key partners in helping to deliver the aims of the WFD across the National Park.
Click on the reference number to take you back to your place in the document.
1. Environment Agency (2012) Abstraction statistics for the South Downs National Park, Environment Agency
2. Ofwat (2012) Data from Water Company June 2011 return to Ofwat available at: www.ofwat.gov.uk/regulating/junereturn/. Accessed 28/5/2012
3. Environment Agency (2012) South East Internal Environmental Data Report for South Downs National Park, Environment Agency
4. Environment Agency (2010) Climate change impacts on Southern Region River Flows, Environment Agency
5. Environment Agency (2009) South East River Basin Management Plan, Environment Agency
6. Environment Agency (2012) Rainfall statistics for the South Downs National Park, Environment Agency